
MATLAB: An Introduction with Applications
6th Edition
ISBN: 9781119256830
Author: Amos Gilat
Publisher: John Wiley & Sons Inc
expand_more
expand_more
format_list_bulleted
Related questions
Topic Video
Question
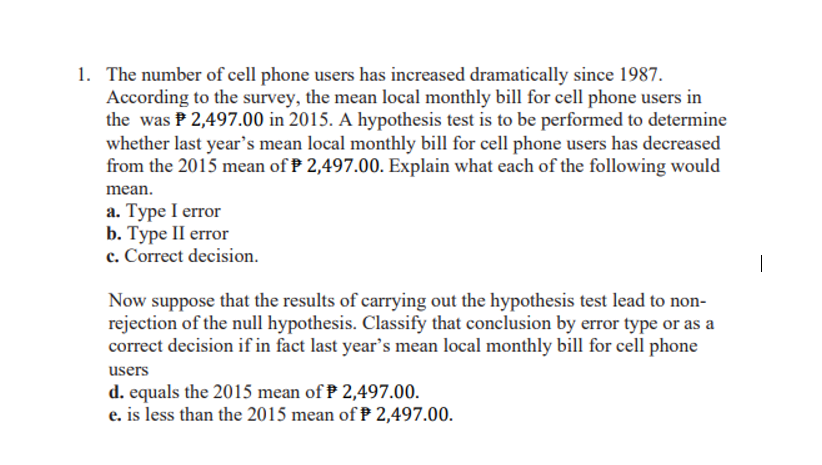

Transcribed Image Text:1. The number of cell phone users has increased dramatically since 1987.
According to the survey, the mean local monthly bill for cell phone users in
the was P 2,497.00 in 2015. A hypothesis test is to be performed to determine
whether last year's mean local monthly bill for cell phone users has decreased
from the 2015 mean of P 2,497.00. Explain what each of the following would
mean.
a. Type I error
b. Туре II error
c. Correct decision.
|
Now suppose that the results of carrying out the hypothesis test lead to non-
rejection of the null hypothesis. Classify that conclusion by error type or as a
correct decision if in fact last year's mean local monthly bill for cell phone
users
d. equals the 2015 mean of P 2,497.00.
e. is less than the 2015 mean of P 2,497.00.
Expert Solution
This question has been solved!
Explore an expertly crafted, step-by-step solution for a thorough understanding of key concepts.

This is a popular solution

Trending nowThis is a popular solution!

Step by stepSolved in 2 steps

Knowledge Booster


Learn more about
Need a deep-dive on the concept behind this application? Look no further. Learn more about this topic, statistics and related others by exploring similar questions and additional content below.Similar questions
- A researcher studying stress is interested in the blood pressure measurements of chief executive officers (CEOs) of major corporations. He has good reason to believe that the mean systolic blood pressure, μ, of CEOs of major corporations is different from 132 mm Hg, which is the value reported in a possibly outdated journal article. He plans to perform a statistical test. He measures the systolic blood pressures of a random sample of CEOs of major corporations and finds the mean of the sample to be 124 mm Hg and the standard deviation of the sample to be 20 mm Hg. Based on this information, complete the parts below. A. H0: H1: B. Suppose that the researcher decides to reject the null hypothesis. Would the research be making a type I or type II error?arrow_forwardA researcher speculates that because of differences in diet, Japanese children have a lower mean blood cholesterol level than U.S. children do. Suppose that the mean level for U.S. children is known to be 175. Let ? represent the true mean blood cholesterol level for Japanese children. What hypotheses should the researcher test? H0: ? = 175 versus Ha: ? > 165H0: ? = 175 versus Ha: ? < 185 H0: ? = 175 versus Ha: ? < 175H0: ? = 175 versus Ha: ? > 175H0: ? = 185 versus Ha: ? > 175arrow_forwardSuppose that you have a set of data that has a mean of 34 and a standard deviation of 6. a) Is the point 28 above, below, or the same as the mean. How many standard deviations is 28 from the mean. b) Is the point 46 above, below, or the same as the mean. How many standard deviations is 46 from the mean. c) Is the point 43 above, below, or the same as the mean. How many standard deviations is 43 from the mean. d) Is the point 20 above, below, or the same as the mean. How many standard deviations is 20 from the mean.arrow_forward
- The mean IQ of 200,000 current and past University of Manitoba students has been found to be 81.9. The standard deviation was found to be 13.1. The student enrollment at the University of Manitoba in 2016 was 29,987. The minimum IQ to be able to graduate from the University of Winnipeg has been found to be 104. Of the 29,987 students at the University of Manitoba in 2016, how many would be expected to be smart enough to graduate from the University of Winnipeg? Assume a Gaussian distribution.arrow_forwardA researcher studying stress is interested in the blood pressure measurements of chief executive officers (CEOS) of major corporations. He believes that the mean systolic blood pressure, H, of CEOS of major corporations is less than 136 mm Hg, which is the value reported in a possibly outdated journal article. He plans to perform a statistical test. He measures the systolic blood pressures of a random sample of CEOs of major corporations and finds the mean of the sample to be 128 mm Hg and the standard deviation of the sample to be 16 mm Hg. Based on this information, answer the questions below. What are the null hypothesis (H) and the alternative hypothesis (H,) that should be used for the test? |Ho: H is ? |H,: µ is ? In the context of this test, what is a Type II error? A Type II error is ? fact, µ is ? v the hypothesis that u is ? when, in Suppose that the researcher decides not to reject the null hypothesis. What sort of error might he be making? ? Continue Save For Later Submit…arrow_forward6. A skateboarder descends on a ramp from 172 feet to 67 feet in 15 seconds. What is the mean change in height per second?arrow_forward
- A quantity measured 50 times results in a mean x=23.345 +/- 0.0022 What is the standard deviation? What number of measurements will cut the standard deviation of the mean half? If a 100 measurement are taken, what is the new standard deviation?arrow_forwardA researcher studying stress is interested in the blood pressure measurements of chief executive officers (CEOs) of major corporations. He has good reason to believe that the mean systolic blood pressure, μ, of CEOs of major corporations is different from 132 mm Hg, which is the value reported in a possibly outdated journal article. He plans to perform a statistical test. He measures the systolic blood pressures of a random sample of CEOs of major corporations and finds the mean of the sample to be 124 mm Hg and the standard deviation of the sample to be 20 mm Hg. Based on this information, complete the parts below. Suppose the true mean systolic blood pressure of CEOs of major corporations is 132 mm Hg. Fill in the four blanks to describe a Type I error. 1. A Type I error would be (rejecting) or (failing to reject) the hypothesis 2. that μ is (less than) (less than or = to) (greater than) (greater than or = to) (not = to) or (= to) 3. the number (124) (132) or (20)…arrow_forwardTwelve percent of the world's population is left-handed. A researcher claims that left-handed individuals are more creative than those who aren't left-handed. In order to support his claim, he takes a sample of 1650 artists and finds that 14% of.them are left-handed. Español Answer the following. (If necessary, consult a list of formulas.) (a) Find the mean of p, where p is the proportion of left-handed individuals in a random sample of 1650. 00 (b) Find the standard deviation of p. (c) Compute an approximation for P (p s0.14), which is the probability that there will be 14% or fewer left-handed people in a random sample of 1650. Round your answer to four decimal places. Save For Later Submit Assignment Check Terms of Use Privacy Center Accessibility acer esc backspaarrow_forward
- According to a gallup survey of boys 77% of boys had played computer games in the past week compared to 65% of girls. You take and SRS of 104 boys and 120 girls\ Would it be reasonable to use the standard deviation formula?arrow_forwardAccording to the New York Daily News, March 5, 2014, people 65 years and older watch an average of 50.5 hours of TV per week. We will estimate the standard deviation to be 12.7 hours per week. Your town has many social programs for senior citizens which may reduce the amount of TV that older people watch. You want to find out if it is true that people 65 and older in your town watch less than 50.5 hours of TV per week. So, you sample 40 people 65 and older in your town. You find that the average time that the 40 people watch per week is 45.8 hours. Can the claim be supported to a level of significance of α = .02, test the hypothesis?arrow_forwardA business school dean in Ohio wants to know if graduates who completed an internship during their undergraduate years earn more than business undergraduates who do not complete an internship while in college. Based on national survey from 1,500 business alumni with less than six years of work experience, they earn on average $50,970 with a standard deviation of $12,976. Business alumni from the Ohio school who completed internships on average earned $53,497. The dean wants you to be 96% confident in your results. a. State in statistical terms the null and alternative hypotheses. b. Determine the appropriate test statistic (z or t). c. Determine the critical value(s). d. Compute the test statistic. e. Make a decision on the hypotheses. (which hypothesis is correct?) f. Determine the p-value for the test statistic.arrow_forward
arrow_back_ios
arrow_forward_ios
Recommended textbooks for you
- MATLAB: An Introduction with ApplicationsStatisticsISBN:9781119256830Author:Amos GilatPublisher:John Wiley & Sons Inc
 Probability and Statistics for Engineering and th...StatisticsISBN:9781305251809Author:Jay L. DevorePublisher:Cengage Learning
 Statistics for The Behavioral Sciences (MindTap C...StatisticsISBN:9781305504912Author:Frederick J Gravetter, Larry B. WallnauPublisher:Cengage Learning
  Elementary Statistics: Picturing the World (7th E...StatisticsISBN:9780134683416Author:Ron Larson, Betsy FarberPublisher:PEARSON
 The Basic Practice of StatisticsStatisticsISBN:9781319042578Author:David S. Moore, William I. Notz, Michael A. FlignerPublisher:W. H. Freeman
 Introduction to the Practice of StatisticsStatisticsISBN:9781319013387Author:David S. Moore, George P. McCabe, Bruce A. CraigPublisher:W. H. Freeman
MATLAB: An Introduction with Applications
Statistics
ISBN:9781119256830
Author:Amos Gilat
Publisher:John Wiley & Sons Inc
Probability and Statistics for Engineering and th...
Statistics
ISBN:9781305251809
Author:Jay L. Devore
Publisher:Cengage Learning
Statistics for The Behavioral Sciences (MindTap C...
Statistics
ISBN:9781305504912
Author:Frederick J Gravetter, Larry B. Wallnau
Publisher:Cengage Learning
Elementary Statistics: Picturing the World (7th E...
Statistics
ISBN:9780134683416
Author:Ron Larson, Betsy Farber
Publisher:PEARSON
The Basic Practice of Statistics
Statistics
ISBN:9781319042578
Author:David S. Moore, William I. Notz, Michael A. Fligner
Publisher:W. H. Freeman
Introduction to the Practice of Statistics
Statistics
ISBN:9781319013387
Author:David S. Moore, George P. McCabe, Bruce A. Craig
Publisher:W. H. Freeman