
MATLAB: An Introduction with Applications
6th Edition
ISBN: 9781119256830
Author: Amos Gilat
Publisher: John Wiley & Sons Inc
expand_more
expand_more
format_list_bulleted
Related questions
Topic Video
Question
thumb_up100%
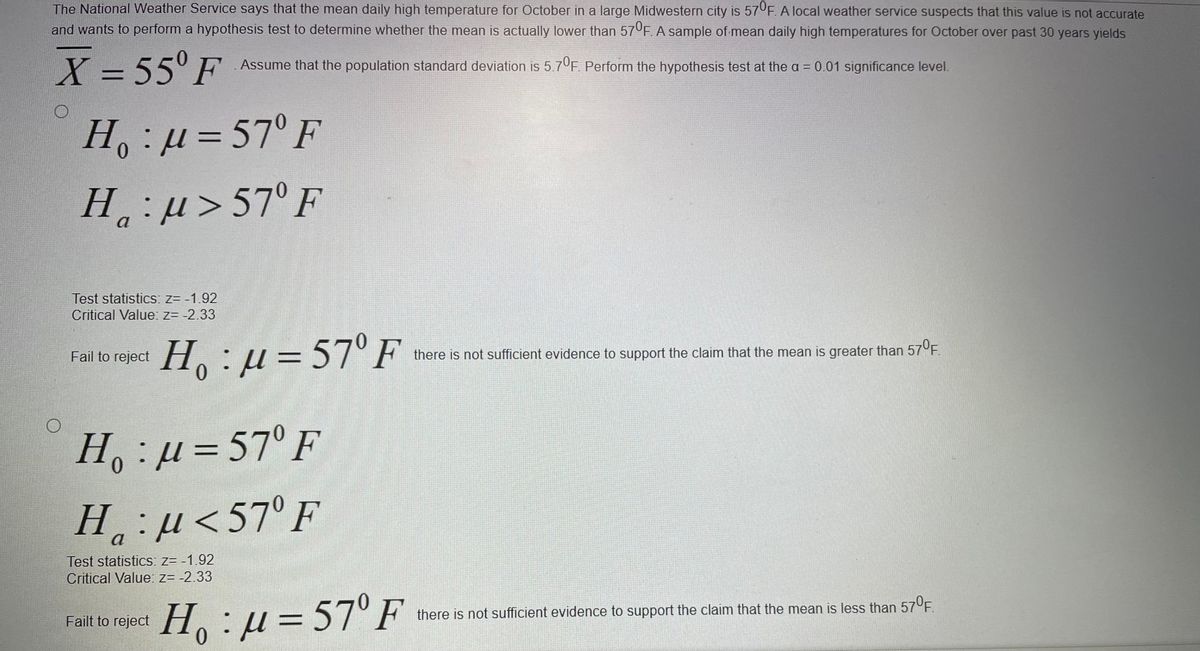

Transcribed Image Text:### Hypothesis Testing on Mean Daily High Temperature
The National Weather Service states that the mean daily high temperature for October in a large Midwestern city is \( 57^\circ F \). A local weather service suspects that this value is not accurate and wants to perform a hypothesis test to determine whether the mean is actually lower than \( 57^\circ F \).
### Given Data
- Sample Mean (\(\bar{X}\)): \( 55^\circ F \)
- Population Standard Deviation (\(\sigma\)): \( 5.7^\circ F \)
- Significance Level (\(\alpha\)): 0.01
We want to perform the hypothesis test at the \(\alpha = 0.01\) significance level.
### Hypothesis Statements
1. Greater than \(57^\circ F\):
- Null Hypothesis (\(H_0\)): \( \mu = 57^\circ F \)
- Alternative Hypothesis (\(H_a\)): \( \mu > 57^\circ F \)
- Test statistics: \( z = -1.92 \)
- Critical Value: \( z = -2.33 \)
- Conclusion: Fail to reject \(H_0: \mu = 57^\circ F\). There is not sufficient evidence to support the claim that the mean is greater than \(57^\circ F\).
2. Less than \(57^\circ F\):
- Null Hypothesis (\(H_0\)): \( \mu = 57^\circ F \)
- Alternative Hypothesis (\(H_a\)): \( \mu < 57^\circ F \)
- Test statistics: \( z = -1.92 \)
- Critical Value: \( z = -2.33 \)
- Conclusion: Fail to reject \(H_0: \mu = 57^\circ F\). There is not sufficient evidence to support the claim that the mean is less than \(57^\circ F\).
### Summary
For both hypothesis tests, the test statistics provided (\(z = -1.92\)) is compared against the critical value (\(z = -2.33\)). In both cases, the null hypothesis is not rejected, indicating insufficient evidence to support either of the alternative hypotheses regarding the mean daily high temperatures differing from \( 57^\circ F \).
Expert Solution
This question has been solved!
Explore an expertly crafted, step-by-step solution for a thorough understanding of key concepts.

This is a popular solution

Trending nowThis is a popular solution!

Step by stepSolved in 2 steps with 1 images

Knowledge Booster


Learn more about
Need a deep-dive on the concept behind this application? Look no further. Learn more about this topic, statistics and related others by exploring similar questions and additional content below.Similar questions
- A simple random sample of 46 men from a normally distributed population results in a standard deviation of 9.6 beats per minute. The normal range of pulse rates of adults is typically given as 60 to 100 beats per minute. If the range rule of thumb is applied to that normal range, the result is a standard deviation of 10 beats per minute. Use the sample results with a 0.10 significance level to test the claim that pulse rates of men have a standard deviation equal to 10 beats per minute. Complete parts (a) through (d) below.arrow_forwardA simple random sample of 49 men from a normally distributed population results in a standard deviation of 7.8 beats per minute. The normal range of pulse rates of adults is typically given as 60 to 100 beats per minute. If the range rule of thumb is applied to that normal range, the result is a standard deviation of 10 beats per minute. Use the sample results with a 0.05 significance level to test the claim that pulse rates of men have a standard deviation equal to 10 beats per minute. Complete parts (a) through (d) below. a. Identify the null and alternative hypotheses. Choose the correct answer below. O A. Ho: o = 10 beats per minute B. Ho: o+ 10 beats per minute H1: o< 10 beats per minute H1: o = 10 beats per minute O C. Ho: o2 10 beats per minute D. Ho: o = 10 beats per minute H1: o< 10 beats per minute H: o + 10 beats per minute b. Compute the test statistic. (Round to three decimal places as needed.) c. Find the P-value. P-value = (Round to four decimal places as needed.) d.…arrow_forwardAn engineer has designed a valve that will regulate water pressure on an automobile engine. The valve was tested on 200 engines and the mean pressure was 4.4 lbs/square inch. Assume the standard deviation is known to be 0.9. If the valve was designed to produce a mean pressure of 4.5 lbs/square inch, is there sufficient evidence at the 0.02 level that the valve performs below the specifications? State the null and alternative hypotheses for the above scenario.arrow_forward
- A simple random sample of 30 men from a normally distributed population results in a standard deviation of 8.7 beats per minute. The normal range of pulse rates of adults is typically given as 60 to 100 beats per minute. If the range rule of thumb is applied to that normal range , the result is a standard deviation of 10 beats per minute. Use the sample results with a 0.05 significance level to test the claim that pulse rates of men have a standard deviation equal to 10 beats per minute. Complete parts a through d below . b. Compute the test statistic. x^2 =____ ( round to three decimal places as needed ) c. Find the p value ___ ( round to four decimal places as needed ) . d. State the conclusionarrow_forwardA simple random sample of 42 men from a normally distributed population results in a standard deviation of 9.9 beats per minute. The normal range of pulse rates of adults is typically given as 60 to 100 beats per minute. If the range rule of thumb is applied to that normal range, the result is a standard deviation of 10 beats per minute. Use the sample results with a 0.05 significance level to test the claim that pulse rates of men have a standard deviation equal to 10 beats per minute. a. Compute the test statistic. chi squared equals (Round to three decimal places as needed.) b. Find the P-value. P-valueequals (Round to four decimal places as needed.)arrow_forwardA simple random sample of 43 men from a normally distributed population results in a standard deviation of 11.1 beats per minute. The normal range of pulse rates of adults is typically given as 60 to 100 beats per minute. If the range rule of thumb is applied to that normal range, the result is a standard deviation of 10 beats per minute. Use the sample results with a 0.10 significance level to test the claim that pulse rates of men have a standard deviation equal to 10 beats per minute. Complete parts (a) through (d) below.arrow_forward
- A simple random sample of 49 men from a normally distributed population results in a standard deviation of 10.5 beats per minute. The normal range of pulse rates of adults is typically given as 60 to 100 beats per minute. If the range rule of thumb is applied to that normal range, the result is a standard deviation of 10 beats per minute. Use the sample results with a 0.10 significance level to test the claim that pulse rates of men have a standard deviation equal to 10 beats per minute. Complete parts (a) through (d) below. TTounu U uree uetima piates as ieeueu.) c. Find the P-value. P-value = | (Round to four decimal places as needed.)arrow_forwardA simple random sample of 46 men from a normally distributed population results in a standard deviation of 7.7 beats per minute. The normal range of pulse rates of adults is typically given as 60 to 100 beats per minute. If the range rule of thumb is applied to that normal range, the result is a standard deviation of 10 beats per minute. Use the sample results with a 0.05 significance level to test the claim that pulse rates of men have a standard deviation equal to 10 beats per minute. Complete parts (a) through (d) below. Question content area bottom Part 1 a. Identify the null and alternative hypotheses. Choose the correct answer below. A. H0: σ≥10 beats per minute H1: σ<10 beats per minute B. H0: σ≠10 beats per minute H1: σ=10 beats per minute C. H0: σ=10 beats per minute H1: σ<10 beats per minute D. H0: σ=10 beats per minute H1: σ≠10 beats per minute Your answer is correct. Part 2 b. Compute the test statistic.…arrow_forwardAn engineer has designed a valve that will regulate water pressure on an automobile engine. The valve was tested on 140 engines and the mean pressure was 6.8 lbs/square inch. Assume the standard deviation is known to be 0.8. If the valve was designed to produce a mean pressure of 6.9 lbs/square inch, is there sufficient evidence at the 0.1 level that the valve does not perform to the specifications? State the null and alternative hypotheses for the above scenario.arrow_forward
- A simple random sample of 46 men from a normally distributed population results in a standard deviation of 7.7 beats per minute. The normal range of pulse rates of adults is typically given as 60 to 100 beats per minute. If the range rule of thumb is applied to that normal range, the result is a standard deviation of 10 beats per minute. Use the sample results with a 0.05 significance level to test the claim that pulse rates of men have a standard deviation equal to 10 beats per minute. Complete parts (a) through (d) below. Question content area bottom Part 1 a. Identify the null and alternative hypotheses. Choose the correct answer below. A. H0: σ≥10 beats per minute H1: σ<10 beats per minute B. H0: σ≠10 beats per minute H1: σ=10 beats per minute C. H0: σ=10 beats per minute H1: σ<10 beats per minute D. H0: σ=10 beats per minute H1: σ≠10 beats per minute Your answer is correct. Part 2 b. Compute the test statistic.…arrow_forwardA simple random sample of 41 men from a normally distributed population results in a standard deviation of 8.1 beats per minute. The normal range of pulse rates of adults is typically given as 60 to 100 beats per minute. If the range rule of thumb is applied to that normal range, the result is a standard deviation of 10 beats per minute. Use the sample results with a 0.05 significance level to test the claim that pulse rates of men have a standard deviation equal to 10 beats per minute. test statistic_____ pvalue______arrow_forwardA simple random sample of 42 men from a normally distributed population results in a standard deviation of 8.4 beats per minute. The normal range of pulse rates of adults is typically given as 60 to 100 beats per minute. If the range rule of thumb is applied to that normal range, the result is a standard deviation of 10 beats per minute. Use the sample results with a 0.10 significance level to test the claim that pulse rates of men have a standard deviation equal to 10 beats per minute. Complete parts (a) through (d) below. O A. Ho: o 10 beats per minute O B. Ho: 0= 10 beats per minute H:g< 10 beats per minute H,:o<10 beats per minute OC. Ho: o = 10 beats per minute O D. Ho: o+ 10 beats per minute H,:0 = 10 beats per minute H,:0# 10 beats per minute b. Compute the test statistic. (Round to three decimal places as needed.) c. Find the P-value. P-value = (Round to four decimal places as needed.) d. State the conclusion. Ho, because the P-value is V the level of significance. There is…arrow_forward
arrow_back_ios
arrow_forward_ios
Recommended textbooks for you
- MATLAB: An Introduction with ApplicationsStatisticsISBN:9781119256830Author:Amos GilatPublisher:John Wiley & Sons Inc
 Probability and Statistics for Engineering and th...StatisticsISBN:9781305251809Author:Jay L. DevorePublisher:Cengage Learning
 Statistics for The Behavioral Sciences (MindTap C...StatisticsISBN:9781305504912Author:Frederick J Gravetter, Larry B. WallnauPublisher:Cengage Learning
  Elementary Statistics: Picturing the World (7th E...StatisticsISBN:9780134683416Author:Ron Larson, Betsy FarberPublisher:PEARSON
 The Basic Practice of StatisticsStatisticsISBN:9781319042578Author:David S. Moore, William I. Notz, Michael A. FlignerPublisher:W. H. Freeman
 Introduction to the Practice of StatisticsStatisticsISBN:9781319013387Author:David S. Moore, George P. McCabe, Bruce A. CraigPublisher:W. H. Freeman
MATLAB: An Introduction with Applications
Statistics
ISBN:9781119256830
Author:Amos Gilat
Publisher:John Wiley & Sons Inc
Probability and Statistics for Engineering and th...
Statistics
ISBN:9781305251809
Author:Jay L. Devore
Publisher:Cengage Learning
Statistics for The Behavioral Sciences (MindTap C...
Statistics
ISBN:9781305504912
Author:Frederick J Gravetter, Larry B. Wallnau
Publisher:Cengage Learning
Elementary Statistics: Picturing the World (7th E...
Statistics
ISBN:9780134683416
Author:Ron Larson, Betsy Farber
Publisher:PEARSON
The Basic Practice of Statistics
Statistics
ISBN:9781319042578
Author:David S. Moore, William I. Notz, Michael A. Fligner
Publisher:W. H. Freeman
Introduction to the Practice of Statistics
Statistics
ISBN:9781319013387
Author:David S. Moore, George P. McCabe, Bruce A. Craig
Publisher:W. H. Freeman