
MATLAB: An Introduction with Applications
6th Edition
ISBN: 9781119256830
Author: Amos Gilat
Publisher: John Wiley & Sons Inc
expand_more
expand_more
format_list_bulleted
Related questions
Concept explainers
Question

Transcribed Image Text:### NFL Game Fan Ratings Analysis
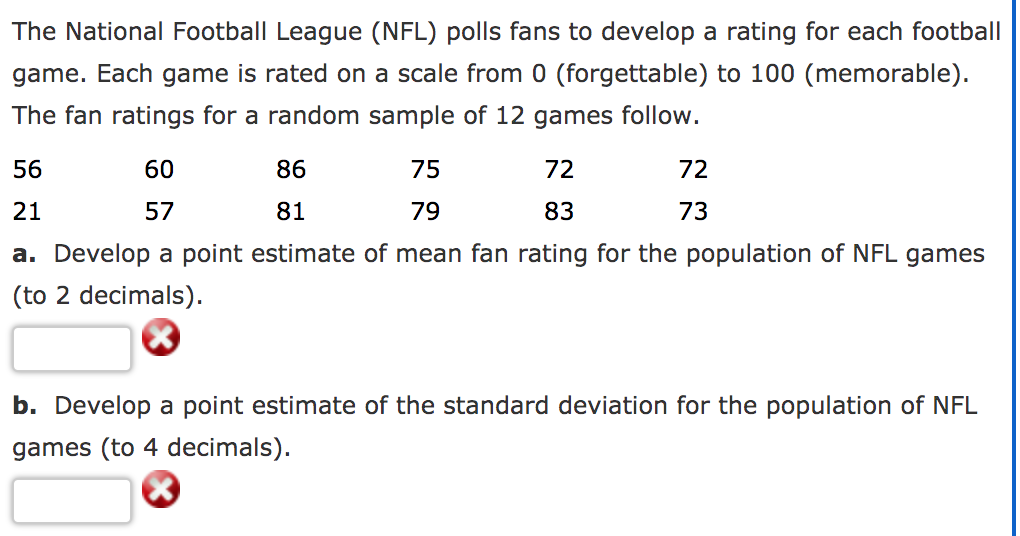
The National Football League (NFL) conducts polls to assign a rating to each football game. These ratings are on a scale from 0 (forgettable) to 100 (memorable). Below are the fan ratings for a random sample of 12 games:
- **Ratings:**
- 56, 60, 86, 75, 72, 72
- 21, 57, 81, 79, 21, 83, 73
#### Tasks:
**a. Calculate the Point Estimate of the Mean Fan Rating**
- **Objective:** Determine the average fan rating for the population of NFL games.
- **Accuracy:** Round your answer to 2 decimal places.
**b. Calculate the Point Estimate of the Standard Deviation**
- **Objective:** Estimate the variability of the fan ratings for the population of NFL games.
- **Accuracy:** Provide your answer to 4 decimal places.
Please input your calculations in the provided boxes for evaluation.
Expert Solution
This question has been solved!
Explore an expertly crafted, step-by-step solution for a thorough understanding of key concepts.

This is a popular solution

Trending nowThis is a popular solution!

Step by stepSolved in 2 steps with 2 images

Knowledge Booster


Learn more about
Need a deep-dive on the concept behind this application? Look no further. Learn more about this topic, statistics and related others by exploring similar questions and additional content below.Similar questions
- Use the grouped data formulas to find the indicated mean or standard deviation. For the following data set, approximate the sample standard deviation. Height (in inches) Frequency 50-52 53-55 56-58 12 59-61 13 62-64 11 Earrow_forwardUsing your calculator, find the range and standard deviation, round to two decimals places:The table below gives the number of hours spent watching TV last week by a sample of 24 children. 71 23 53 59 75 72 34 26 52 78 38 50 65 83 54 87 60 84 23 83 90 28 94 10 Range = Standard Deviation =arrow_forwardThe estimated distribution (in millions) of the population by age in a certain country for the year 2015 is shown in the pie chart. Make a frequency distribution for the data. Then use the table to estimate the sample mean and the sample standard deviation of the data set. Use 70 as the midpoint for "65 years and over." I Under 4 years: 18.5 I 5-14 years: 39.7 O 15-19 years: 17.4 O 20-24 years: 18.7 I 25-34 years: 40.8 I 35-44 years: 36.2 I 45-64 years: 84.7 I 65 years and over: 54.7 The sample mean is x=. (Round to two decimal places as needed.) The sample standard deviation is s = (Round to two decimal places as needed.)arrow_forward
- Exam Grade 55 91 88 188 33 98 78 170 59 88 10 Given the above data set, what is the sample standard deviation of Study hours using a sample of the following students (Student Numbers: 1,3,5,9). Round to the nearest hundredth. Student # 11 2 3 14 5600 7 Study Hours 42 22 24 19 51 11 22 9 39arrow_forwardEach year, tornadoes that touch down are recorded. The following table gives the number of tornadoes that touched down during each month of one year. Determine the range and sample standard deviation. Range = 3 65 tornadoes 4 82 49 62 S= (Round to two decimal places as needed.) 116 60 203 102 91 91arrow_forwardThe ages for a sample of fans at a concert are listed. Whats the mean, median, mode, range, variance, standard deviation, and coefficient of variation?arrow_forward
- The top 16 winning scores for NFL games are listed below. Find the mean score. Video Tutorial: How to find the mean on a TI-84 72 54 52 54 70 51 56 58 58 52 51 63 51 48 52 61 A. 54 B. 57.1 C. 63.2 D. 56.4arrow_forwardThe grades for 30 students on the most recent exam are given in the data table below: Round your answer to 2 decimal places as needed 70 70 80 80 70 60 90 80 80 80 60 70 70 70 70 90 70 70 80 90 60 90 70 60 90 70 06 90 90 80 What is the mean score for the exam? What is the median score for the exam? What is the standard deviation for the exam?arrow_forwardUsing technology, find the range and standard deviation, round to one decimals place:The table below gives the number of hours spent watching TV last week by a sample of 24 children. 20 39 34 29 48 84 64 25 75 89 40 57 82 43 62 52 49 59 38 87 49 66 95 17 Range = 78 Standard Deviation = 22.6arrow_forward
- Calculate the mean, median and sample standard deviation for the following data. 1, 5, 2, 6, 8arrow_forwardThe ages (in years) of a random sample of shoppers at a gaming store are shown. Determine the range, mean, variance, and standard deviation of the sample data set. 12, 20, 23, 14, 13, 17, 19, 18, 13, 16 Determine the range, mean, variance, and standard deviation of the sample data set.arrow_forwardNext question The ages (in years) of a random sample of shoppers at a gaming store are shown. Determine the range, mean, variance, and sta the sample data set. 12, 16, 23, 14, 17, 18, 21, 18, 15, 15 9 ...... The range is: (Simplify your answer.)arrow_forward
arrow_back_ios
SEE MORE QUESTIONS
arrow_forward_ios
Recommended textbooks for you
- MATLAB: An Introduction with ApplicationsStatisticsISBN:9781119256830Author:Amos GilatPublisher:John Wiley & Sons Inc
 Probability and Statistics for Engineering and th...StatisticsISBN:9781305251809Author:Jay L. DevorePublisher:Cengage Learning
 Statistics for The Behavioral Sciences (MindTap C...StatisticsISBN:9781305504912Author:Frederick J Gravetter, Larry B. WallnauPublisher:Cengage Learning
  Elementary Statistics: Picturing the World (7th E...StatisticsISBN:9780134683416Author:Ron Larson, Betsy FarberPublisher:PEARSON
 The Basic Practice of StatisticsStatisticsISBN:9781319042578Author:David S. Moore, William I. Notz, Michael A. FlignerPublisher:W. H. Freeman
 Introduction to the Practice of StatisticsStatisticsISBN:9781319013387Author:David S. Moore, George P. McCabe, Bruce A. CraigPublisher:W. H. Freeman
MATLAB: An Introduction with Applications
Statistics
ISBN:9781119256830
Author:Amos Gilat
Publisher:John Wiley & Sons Inc
Probability and Statistics for Engineering and th...
Statistics
ISBN:9781305251809
Author:Jay L. Devore
Publisher:Cengage Learning
Statistics for The Behavioral Sciences (MindTap C...
Statistics
ISBN:9781305504912
Author:Frederick J Gravetter, Larry B. Wallnau
Publisher:Cengage Learning
Elementary Statistics: Picturing the World (7th E...
Statistics
ISBN:9780134683416
Author:Ron Larson, Betsy Farber
Publisher:PEARSON
The Basic Practice of Statistics
Statistics
ISBN:9781319042578
Author:David S. Moore, William I. Notz, Michael A. Fligner
Publisher:W. H. Freeman
Introduction to the Practice of Statistics
Statistics
ISBN:9781319013387
Author:David S. Moore, George P. McCabe, Bruce A. Craig
Publisher:W. H. Freeman