
MATLAB: An Introduction with Applications
6th Edition
ISBN: 9781119256830
Author: Amos Gilat
Publisher: John Wiley & Sons Inc
expand_more
expand_more
format_list_bulleted
Related questions
Concept explainers
Topic Video
Question
18
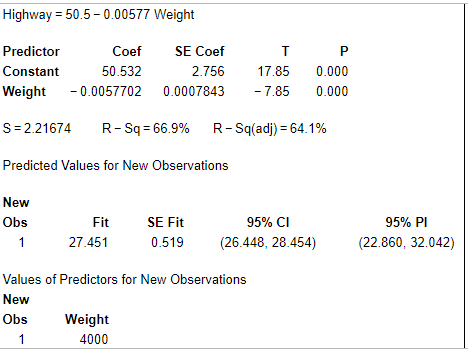

Transcribed Image Text:Highway = 50.5 - 0.00577 Weight
Predictor
Coef
SE Coef
T
P
Constant
50.532
2.756
17.85
0.000
Weight
- 0.0057702 0.0007843
- 7.85
0.000
S=2.21674
R-Sq = 66.9% R-Sq(adj) = 64.1%
Predicted Values for New Observations
New
Obs
Fit
SE Fit
95% CI
95% PI
1
27.451
0.519
(26.448, 28.454)
(22.860, 32.042)
Values of Predictors for New Observations
New
Obs
Weight
1
4000

Transcribed Image Text:The Minitab output shown below was obtained by using paired data consisting of weights (in Ib) of 27 cars and their highway fuel consumption amounts (in mi/gal). Along with the paired sample data, Minitab was also given a car
weight of 4000 lb to be used for predicting the highway fuel consumption amount. Use the information provided in the display to determine the value of the linear correlation coefficient. (Be careful to correctly identify the sign of the
correlation coefficient.) Given that there are 27 pairs of data, is there sufficient evidence to support a claim of linear correlation between the weights of cars and their highway fuel consumption amounts?
E Click the icon to view the Minitab display.
The linear correlation coefficient is
(Round to three decimal places as needed.)
Is there sufficient evidence to support a claim of linear correlation?
O Yes
O No
Expert Solution
This question has been solved!
Explore an expertly crafted, step-by-step solution for a thorough understanding of key concepts.

This is a popular solution

Trending nowThis is a popular solution!

Step by stepSolved in 2 steps

Knowledge Booster


Learn more about
Need a deep-dive on the concept behind this application? Look no further. Learn more about this topic, statistics and related others by exploring similar questions and additional content below.Similar questions
Recommended textbooks for you
- MATLAB: An Introduction with ApplicationsStatisticsISBN:9781119256830Author:Amos GilatPublisher:John Wiley & Sons Inc
 Probability and Statistics for Engineering and th...StatisticsISBN:9781305251809Author:Jay L. DevorePublisher:Cengage Learning
 Statistics for The Behavioral Sciences (MindTap C...StatisticsISBN:9781305504912Author:Frederick J Gravetter, Larry B. WallnauPublisher:Cengage Learning
  Elementary Statistics: Picturing the World (7th E...StatisticsISBN:9780134683416Author:Ron Larson, Betsy FarberPublisher:PEARSON
 The Basic Practice of StatisticsStatisticsISBN:9781319042578Author:David S. Moore, William I. Notz, Michael A. FlignerPublisher:W. H. Freeman
 Introduction to the Practice of StatisticsStatisticsISBN:9781319013387Author:David S. Moore, George P. McCabe, Bruce A. CraigPublisher:W. H. Freeman
MATLAB: An Introduction with Applications
Statistics
ISBN:9781119256830
Author:Amos Gilat
Publisher:John Wiley & Sons Inc
Probability and Statistics for Engineering and th...
Statistics
ISBN:9781305251809
Author:Jay L. Devore
Publisher:Cengage Learning
Statistics for The Behavioral Sciences (MindTap C...
Statistics
ISBN:9781305504912
Author:Frederick J Gravetter, Larry B. Wallnau
Publisher:Cengage Learning
Elementary Statistics: Picturing the World (7th E...
Statistics
ISBN:9780134683416
Author:Ron Larson, Betsy Farber
Publisher:PEARSON
The Basic Practice of Statistics
Statistics
ISBN:9781319042578
Author:David S. Moore, William I. Notz, Michael A. Fligner
Publisher:W. H. Freeman
Introduction to the Practice of Statistics
Statistics
ISBN:9781319013387
Author:David S. Moore, George P. McCabe, Bruce A. Craig
Publisher:W. H. Freeman