A First Course in Probability (10th Edition)
10th Edition
ISBN: 9780134753119
Author: Sheldon Ross
Publisher: PEARSON
expand_more
expand_more
format_list_bulleted
Topic Video
Question

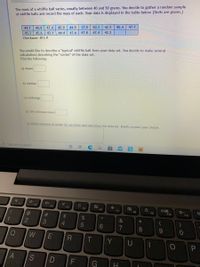
Transcribed Image Text:The mass of a whiffle ball varies, usually between 40 and 50 grams. You decide to gather a random sample
of whiffle balls and record the mass of each. Your data is displayed in the table below. (Units are grams.)
37.9
50.3
42.5
45.4
47.7
44.1
44,4
47.4
45.9
44.9
45.3 45.6 43.1
44.4
47.6
47.8
47.4
42.2
Checksum: 813.9
You would like to describe a "typical" whiffle ball from your data set. You decide to make several
calculations describing the "center" of the data set.
Find the following:
a) mean
b) median
c) midrange
d) 10% trimmed mean
e) Which measure of center do you think best describes this data set. Briefly explain your choice.
9Type here to search
FI
2
C
F3
F4
F5
F6
*-
F11
F7
F8
F9
F10
%23
&
*
3
4.
6.
8.
9.
Y
G
5
LL
%24

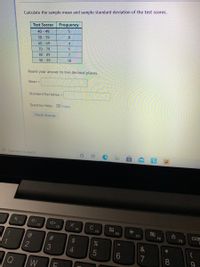
Transcribed Image Text:Calculate the sample mean and sample standard deviation of the test scores.
Test Scores
Frequency
40 49
50 59
60 - 69
70 79
8
4
1
80 -89
90 99
10
Round
your answer to two decimal places.
Mean =
Standard Deviation =
Question Help: D Video
Check Answer
Type here to search
F1
F2
F3
C
F4
F5
F6
F7
F8
F9
2
4.
7
8
23
LL
Expert Solution
This question has been solved!
Explore an expertly crafted, step-by-step solution for a thorough understanding of key concepts.
This is a popular solution
Trending nowThis is a popular solution!
Step by stepSolved in 2 steps

Knowledge Booster
Learn more about
Need a deep-dive on the concept behind this application? Look no further. Learn more about this topic, probability and related others by exploring similar questions and additional content below.Similar questions
- A statistics student wanted to investigate the weights of bags of a popular chocolate candy. The data for the weights of the bags, in ounces, are given below. 1.78 1.67 1.86 1.72 1.69 1.78 1.75 1.74 1.7 Which of the following boxplots correctly displays the data?arrow_forwardA good shipment of product has 3% defective and a bad shipment has 6% of defective.If 50 samples are inspected and the maximum accepted number of defective is 3 units. Determine the producer’s risk. A. 0.065 B. 0.987 C. 0.935 D. 0.353 Thanksarrow_forwardListed below are pulse rates (beats per minute) from samples of adult males and females. Find the mean and median for each of the two samples and then compare the two sets of results. D there appear to be a difference? Male: Female: 86 71 54 84 57 95 53 89 53 63 59 82 53 91 88 72 68 85 87 90 91 88 70 92 77 63 94 82 86 64 Find the means. The mean for males is 71.9 beats per minute and the mean for females is 80.6 beats per minute. (Type integers or decimals rounded to one decimal place as needed.) Find the medians. The median for males is 71 beats per minute and the median for females is 85 beats per minute. (Type integers or decimals rounded to one decimal place as needed.) Compare the results. Choose the correct answer below. OA. The mean and median appear to be roughly the same for both genders. OB. The mean and the median for males are both lower than the mean and the median for females. OC. The mean and the median for females are both lower than the mean and the median for males.…arrow_forward
- Each box weighs the same. Which statement is TRUE when comparing the interquartile range (IQR) of the data? 38 32 32 33 29 28 27 26 25 23 Range = Max - Min IQR = Q3-Q1 Brand C Brand Darrow_forwardTwo varieties of corn are grown in 4 different locations. Each location provides a value in pounds for each variety.The table below lists the results. Find the standard error for the difference in the production of the two corn varieties to two decimal places. Variety 1 Variety 2 difference location 1 32.1 34.5 -2.4 location 2 30.6 32.6 -2.0 location 3 33.7 34.6 -0.9 location 4 29.7 31.6 -1.3 mean value 31.53 33.18 -1.65 standard deviation 1.76 1.72 0.68 1.23 0.75 0.34 0.98arrow_forwardyour car is more crowded than you think. table 5.8 reports results from a 1969 personal transportation survey on "home-to-work" trips in metropolitan areas. The survey stated that the average car occupancy was 1.4 people. check that calculation.arrow_forward
arrow_back_ios
arrow_forward_ios
Recommended textbooks for you
 A First Course in Probability (10th Edition)ProbabilityISBN:9780134753119Author:Sheldon RossPublisher:PEARSON

A First Course in Probability (10th Edition)
Probability
ISBN:9780134753119
Author:Sheldon Ross
Publisher:PEARSON
