MATLAB: An Introduction with Applications
6th Edition
ISBN: 9781119256830
Author: Amos Gilat
Publisher: John Wiley & Sons Inc
expand_more
expand_more
format_list_bulleted
Question
thumb_up100%

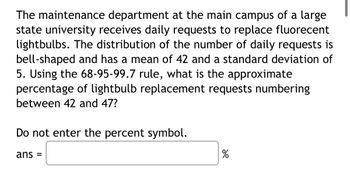
Transcribed Image Text:The maintenance department at the main campus of a large
state university receives daily requests to replace fluorecent
lightbulbs. The distribution of the number of daily requests is
bell-shaped and has a mean of 42 and a standard deviation of
5. Using the 68-95-99.7 rule, what is the approximate
percentage of lightbulb replacement requests numbering
between 42 and 47?
Do not enter the percent symbol.
ans =
%
Expert Solution
This question has been solved!
Explore an expertly crafted, step-by-step solution for a thorough understanding of key concepts.
This is a popular solution
Trending nowThis is a popular solution!
Step by stepSolved in 2 steps

Knowledge Booster
Similar questions
- Assume that the Leaf Area Index over a management area is normally distributed with a mean of 3 and a standard deviation of 0.2. One sample area shows a LAI of 2.76. How many standard deviations is this measurement from the mean?arrow_forwardHigh-rent district: The mean monthly rent for a one-bedroom apartment without a doorman in Manhattan is $2550. Assume the standard deviation is $485. A real estate firm samples 85 apartments. Use Excel.arrow_forwardAssume that the readings at freezing on a bundle of thermometers are normally distributed with a mean of 0°C and a standard deviation of 1.00°C. A single thermometer is randomly selected and tested. Find P9, the 69-percentile. This is the temperature reading separating the bottom 69% from the top 31%. P69 %3Darrow_forward
- Assume that the readings at freezing on a batch of thermometers are normally distributed with a mean of 0°C and a standard deviation of 1.00°C. A single thermometer is randomly selected and tested. Find P42, the 42-percentile. This is the temperature reading separating the bottom 42% from the top 58%. P42 = °Carrow_forwardA distance is measured six times. The observed values are 572.182 m, 572.140 m, 572.103 m, 572.160 m, 572.125 m, and 572.155 m. All measurements are uncorrelated and their standard deviations are 0.030 m, 0.030 m, 0.030 m, 0.020 m, 0.020 m, and 0.010 m, respectively. Find the least squares estimate for the distance. Use matrices and R in the solution. Write the R commands involved.arrow_forwardFind the indicated IQ score. The graph to the right depicts IQ scores of adults, and those scores are normally distributed with a mean of 100 and a standard deviation of 15.arrow_forward
- Use the Empirical Rule. The mean speed of a sample of vehicles along a stretch of highway is 68 miles per hour, with a standard deviation of 3 miles per hour. Estimate the percent of vehicles whose speeds are between 65 miles per hour and 71 miles per hour. (Assume the data set has a bell-shaped distribution.) Approximately nothing% of vehicles travel between 65 miles per hour and 71 miles per hour.arrow_forwardA farm hatches chicken eggs in batches of 15 and there is a 3% infertile rate. Find the standard deviation for the number of infertile eggs per batch. 0.2 O 0.44 0.45 O 0.66 O 43.7arrow_forwardAssume that the readings at freezing on a batch of thermometers are normally distributed with a mean of 0°C and a standard deviation of 1.00°C. A single thermometer is randomly selected and tested. Find P70, the 70-percentile. This is the temperature reading separating the bottom 70% from the top 30%.P70 = °C(Round answer to three decimal places)arrow_forward
- People's oxygen saturation is normally distributed and has a mean measurement of 98.7 and a standard deviation of 1.2. Find the oxygen saturation for P35arrow_forwardAssume that the readings at freezing on a batch of thermometers are normally distributed with a mean of 0°C and a standard deviation of 1.00°C. A single thermometer is randomly selected and tested. Find P50, the 50-percentile. This is the temperature reading separating the bottom 50% from the top 50%. Round to 3 decimal places.arrow_forward
arrow_back_ios
arrow_forward_ios
Recommended textbooks for you
 MATLAB: An Introduction with ApplicationsStatisticsISBN:9781119256830Author:Amos GilatPublisher:John Wiley & Sons Inc
 Probability and Statistics for Engineering and th...StatisticsISBN:9781305251809Author:Jay L. DevorePublisher:Cengage Learning
 Statistics for The Behavioral Sciences (MindTap C...StatisticsISBN:9781305504912Author:Frederick J Gravetter, Larry B. WallnauPublisher:Cengage Learning
 Elementary Statistics: Picturing the World (7th E...StatisticsISBN:9780134683416Author:Ron Larson, Betsy FarberPublisher:PEARSON
 The Basic Practice of StatisticsStatisticsISBN:9781319042578Author:David S. Moore, William I. Notz, Michael A. FlignerPublisher:W. H. Freeman
 Introduction to the Practice of StatisticsStatisticsISBN:9781319013387Author:David S. Moore, George P. McCabe, Bruce A. CraigPublisher:W. H. Freeman

MATLAB: An Introduction with Applications
Statistics
ISBN:9781119256830
Author:Amos Gilat
Publisher:John Wiley & Sons Inc

Probability and Statistics for Engineering and th...
Statistics
ISBN:9781305251809
Author:Jay L. Devore
Publisher:Cengage Learning

Statistics for The Behavioral Sciences (MindTap C...
Statistics
ISBN:9781305504912
Author:Frederick J Gravetter, Larry B. Wallnau
Publisher:Cengage Learning

Elementary Statistics: Picturing the World (7th E...
Statistics
ISBN:9780134683416
Author:Ron Larson, Betsy Farber
Publisher:PEARSON

The Basic Practice of Statistics
Statistics
ISBN:9781319042578
Author:David S. Moore, William I. Notz, Michael A. Fligner
Publisher:W. H. Freeman

Introduction to the Practice of Statistics
Statistics
ISBN:9781319013387
Author:David S. Moore, George P. McCabe, Bruce A. Craig
Publisher:W. H. Freeman