
MATLAB: An Introduction with Applications
6th Edition
ISBN: 9781119256830
Author: Amos Gilat
Publisher: John Wiley & Sons Inc
expand_more
expand_more
format_list_bulleted
Related questions
Question
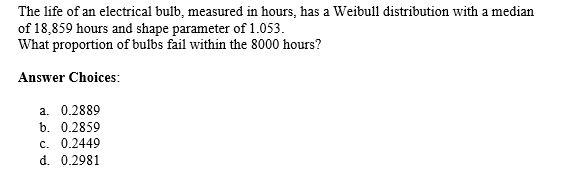

Transcribed Image Text:The life of an electrical bulb, measured in hours, has a Weibull distribution with a median
of 18,859 hours and shape parameter of 1.053.
What proportion of bulbs fail within the 8000 hours?
Answer Choices:
a. 0.2889
b. 0.2859
c. 0.2449
d. 0.2981
Expert Solution
This question has been solved!
Explore an expertly crafted, step-by-step solution for a thorough understanding of key concepts.

This is a popular solution

Trending nowThis is a popular solution!

Step by stepSolved in 3 steps with 1 images

Knowledge Booster

Similar questions
- A survey of 100 fatal accidents showed that 26 were alcohol related. Find a point estimate for p, the population proportion of accidents that were alcohol related. O A. 0.351 ОВ. 0.74 O C. 0.206 O D. 0.26arrow_forwardLook the image and answer the following questions: a. What is the independent variable (IV)? b. How many levels do we have for the IV? C. What is the level of measurement for the IV? d. What is the DV (remember, the DV is the data)? e.What is the level of measurement of the DV? f. Why a Bar graph is the best graph to display this data? Explain g. Construct a Bar graph that incorporates all the information in this table. h. Looking at your graph, do you think that the relaxation training really worked. Explain your answer.arrow_forwardc. Find the 95th percentile. (Round to three decimal places as needed.)arrow_forward
- For which measure of center must the data be ranked? A. Mode B. Standard Deviation C. Median D. Meanarrow_forwardEyeglassomatic manufactures eyeglasses for different retailers. They test to see how many defective lenses they made the time period of January 1 to March 31. The table gives the defect and the number of defects. Do the data support the notion that each defect type occurs in the same proportion? Test at the 5% level. Number of Defective Lenses Defect type Number of defects Scratch 1866 Right shaped - small 1935 Flaked 1979 Wrong axis 1921 Chamfer wrong 1864 Crazing, cracks 1991 Wrong shape 2004 Wrong PD 1895 Spots and bubbles 1917 Wrong height 1885 Right shape - big 1875 Lost in lab 1886 Spots/bubble - intern 1935 State the hypotheses.H0: Each defect type in the same proportion.Ha: Each defect type in the same proportion. Calculate the χ2 test statistic. Round expected values to two decimal places. Round χ2 to three decimal places.χ2 = Calculate the p-value. Round to four decimal places.p-value = State your decision.Since p-value 0.05,…arrow_forwardAn investigation of the properties of bricks used to line aluminum smelter pots was published in an article. Six different commercial bricks were evaluated. The life span of a smelter pot depends on the porosity of the brick lining (the less porosity, the longer the life span); consequently, the researchers measured the apparent porosity of each brick specimen, as well as the mean pore diameter of each brick. See the table. Apparent Porosity (y). Mean Pore Diameter (x). Click the icon to view the table. Data table Mean Pore Diameter Apparent Porosity (%) (micrometers) Brick Interpret the y-intercept of the line. Choose the correct answer below. 18.7 12.0 В 18.3 9.8 O A. The y-intercept is Bo- This value has no meaning because 0 is not in the observed range of the independent variable mean pore diameter. 16.3 7.3 6.9 5.4 O B. The y-intercept is Bo: For each unit increase in mean pore diameter, the mean porosity is estimated to increase by B0- 17.2 10.9 O C. There is not enough…arrow_forward
- Listed below are the measured radiation absorption rates (in W. 5-number summary. 1.12 0.52 0.51 0.92 0.7arrow_forwardDraw a box plot for the following data: Median: 4.5 Lowest Value: 1 Greatest Value: 9 Lower Quartile: 2.5 Interquartile Range: 6 8 10arrow_forwardUse the following cell phone airport data speeds (Mbps) from a particular network. Find the percentile corresponding to the data speed 0.9 Mbps. Percentile of 0.9 equals (Round to the nearest whole number as needed.)arrow_forward
- When performing a test about the population proportion, what distribution would you need to use? Select one: O a. z O b. chi-square O c.tarrow_forwardThe indicated IQ score, x, isarrow_forwardA survey is carried out at a university to estimate the percentage of undergraduates living at home during the current term. What is the population? the parameter?arrow_forward
arrow_back_ios
SEE MORE QUESTIONS
arrow_forward_ios
Recommended textbooks for you
- MATLAB: An Introduction with ApplicationsStatisticsISBN:9781119256830Author:Amos GilatPublisher:John Wiley & Sons Inc
 Probability and Statistics for Engineering and th...StatisticsISBN:9781305251809Author:Jay L. DevorePublisher:Cengage Learning
 Statistics for The Behavioral Sciences (MindTap C...StatisticsISBN:9781305504912Author:Frederick J Gravetter, Larry B. WallnauPublisher:Cengage Learning
  Elementary Statistics: Picturing the World (7th E...StatisticsISBN:9780134683416Author:Ron Larson, Betsy FarberPublisher:PEARSON
 The Basic Practice of StatisticsStatisticsISBN:9781319042578Author:David S. Moore, William I. Notz, Michael A. FlignerPublisher:W. H. Freeman
 Introduction to the Practice of StatisticsStatisticsISBN:9781319013387Author:David S. Moore, George P. McCabe, Bruce A. CraigPublisher:W. H. Freeman
MATLAB: An Introduction with Applications
Statistics
ISBN:9781119256830
Author:Amos Gilat
Publisher:John Wiley & Sons Inc
Probability and Statistics for Engineering and th...
Statistics
ISBN:9781305251809
Author:Jay L. Devore
Publisher:Cengage Learning
Statistics for The Behavioral Sciences (MindTap C...
Statistics
ISBN:9781305504912
Author:Frederick J Gravetter, Larry B. Wallnau
Publisher:Cengage Learning
Elementary Statistics: Picturing the World (7th E...
Statistics
ISBN:9780134683416
Author:Ron Larson, Betsy Farber
Publisher:PEARSON
The Basic Practice of Statistics
Statistics
ISBN:9781319042578
Author:David S. Moore, William I. Notz, Michael A. Fligner
Publisher:W. H. Freeman
Introduction to the Practice of Statistics
Statistics
ISBN:9781319013387
Author:David S. Moore, George P. McCabe, Bruce A. Craig
Publisher:W. H. Freeman