MATLAB: An Introduction with Applications
6th Edition
ISBN: 9781119256830
Author: Amos Gilat
Publisher: John Wiley & Sons Inc
expand_more
expand_more
format_list_bulleted
Question

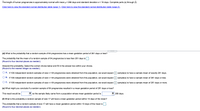
Transcribed Image Text:The length of human pregnancies is approximately normal with mean p = 266 days and standard deviation o = 16 days. Complete parts (a) through (f).
Click here to view the standard normal distribution table (page 1). Click here to view the standard normal distribution table (page 2).
(d) What is the probability that a random sample of 64 pregnancies has a mean gestation period of 261 days or less?
The probability that the mean of a random sample of 64 pregnancies is less than 261 days is
(Round to four decimal places as needed.)
Interpret this probability. Select the correct choice below and fill in the answer box within your choice.
(Round to the nearest integer as needed.)
O A. If 100 independent random samples of size n= 64 pregnancies were obtained from this population, we would expect
sample(s) to have a sample mean of exactly 261 days.
B. If 100 independent random samples of size n= 64 pregnancies were obtained from this population, we would expect
sample(s) to have a sample mean of 261 days or less.
C. If 100 independent random samples of size n= 64 pregnancies were obtained from this population, we would expect
sample(s) to have a sample mean of 261 days or more.
(e) What might you conclude if a random sample of 64 pregnancies resulted in a mean gestation period of 261 days or less?
This result would be
so the sample likely came from a population whose mean gestation period is
266 days.
(f) What is the probability a random sample of size 17 will have a mean gestation period within 10 days of the mean?
The probability that a random sample of size 17 will have a mean gestation period within 10 days of the mean is.
(Round to four decimal places as needed.)

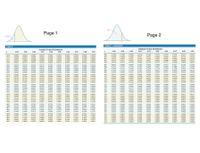
Transcribed Image Text:Area
Page 1
Page 2
Area-
Table V (continued)
Table V
Standard Normal Distribution
Standard Normal Distribution
0,04
0,00
0,01
0.02
0.03
0.04
0,05
0,06
0.07
0.08
0.09
0,00
0,01
0,03
0,05
0,06
0,08
0,09
0.5120
0.5517
0.5910
0.6293
0,6664
0.5160
0.5557
0.5948
0.6331
0.6700
0.5199
0.5596
0.5000
0.5398
0.5793
0.6179
0.6554
0.5040
0.5438
0,5832
0,6217
0.6591
0.5239
0.5636
0.6026
0.6406
0.6772
0.5279
0.5675
0.6064
0.6443
0.6808
0.5319
0.5714
0.6103
0,6480
0.6844
0.5359
0.5753
0.6141
0.6517
0.6879
0.0
0.5080
0.0003
0,0005
0.0003
0,0004
0.0006
0.0008
-3.4
-3.3
0.0003
0.0005
0.0007
0.0010
0.0003
0.0005
0.0003
0.0004
0,0003
0.0004
0.0005
0.0007
0,0010
0,0003
0.0003
0.0004
0,0003
0.0002
0.0003
0.0005
0,0007
0.0010
0.5478
0.5871
0.6255
0,6628
0.0004
0.0004
0.1
0.5987
0.6368
0.6736
0,2
-3.2
-3.1
-3,0
0.0007
0.0009
0.0013
0.0006
0.0009
0.0012
0.0005
0.0008
0.0006
0.0006
0.0006
0,0009
0.0013
0.3
0.4
0.0008
0.0008
0.0013
0.0012
0.0011
0,0011
0.0011
0.5
0.6
0.7
0.6915
0.7257
0.7580
0.7881
0.8159
0,6950
0.7291
0.7611
0,6985
0.7324
0.7642
0.7939
0.8212
0.7019
0.7357
0.7673
0.7967
0.8238
0.7123
0.7454
0.7764
0.8051
0.8315
0.7157
0.7486
0.7794
0.8078
0.8340
0.7054
-2.9
-2.8
-2.7
-2.6
-2.5
0.0019
0.0026
0,0035
0.0047
0.0062
0,0018
0.0025
0.0034
0.0045
0.0060
0,0018
0.0024
0.0033
0.0044
0.0017
0,0023
0.0032
0,0016
0.0023
0.0031
0.0041
0.0055
0.0016
0.0022
0.0030
0.0040
0.0054
0,0015
0,0021
0.0029
0.0039
0.0052
0.0015
0.0021
0,0028
0,0038
0.0014
0,0020
0.0027
0.0037
0,0014
0,0019
0.0026
0.0036
0.0048
0.7088
0.7422
0.7734
0.8023
0.8289
0.7190
0.7517
0,7823
0.7224
0.7549
0.7852
0.8133
0.8389
0.7389
0.7704
0.0043
0.0057
0.8
0.7910
0.7995
0.8106
0.0059
0.0051
0,0049
0.9
0.8186
0.8264
0.8365
0.8413
0.8643
0.8849
0.9032
0.9192
0,8438
0.8665
0.8508
0.8729
0.8925
0.9099
0.8554
0.8770
0.8962
0.9131
0.9279
1.0
0.8461
0.8485
0.8531
0.8577
0,8599
0.8621
0.8830
0.0082
0.0107
0,0139
0.0078
0.0102
0.0132
0.0170
0.0217
0.0071
0.0094
0.0122
0.0158
0.0202
0.0075
0.0073
0.0064
-2.4
-2.3
0.0080
0.0104
0.0136
0.0069
0.0091
0.0068
0.0089
0.0066
0.0087
0.8708
0.8907
0.9082
0.9236
0.8790
0.8980
0.9147
0.9292
0.8810
0.8997
0.9162
0,9306
1.1
0.8686
0.8749
0.8944
0.9115
0.9265
0,0099
0.0096
0.0084
-2,2
-2.1
-2.0
0.0129
0.0166
0.0212
0.0125
0.0162
0,0207
0,0119
0,0154
0.0113
0.0146
0.0188
1.2
1.3
1.4
0.9015
0.9177
0.9319
0,8869
0.8888
0.0179
0.0228
0.0174
0.0222
0,0116
0,0150
0.0192
0.0110
0.0143
0.0183
0.9049
0.9207
0,9066
0.0197
0.9222
0.9251
0.0256
0.0322
0.0401
0.0495
0.0244
0.0307
0.0384
0.0239
0.0301
0.0375
0.0465
0.0571
1.5
1.6
1.7
0.9332
0.9452
0.9554
0.9345
0.9463
0.9564
0.9357
0.9474
0.9573
0.9656
0.9726
0.9370
0.9484
0.9582
0.9664
0.9732
0.9418
0.9525
0.9616
0.9693
0.9756
0.9429
0,9535
0.9625
0.9699
0.9761
0.9441
0.9545
0.9633
0.9706
0.9767
0.9382
0.9495
-1.9
-1.8
-1.7
0,0287
0,0359
0,0446
0.0548
0.0281
0.0351
0.0436
0.0537
0.0655
0.0268
0.0336
0.0418
0.0516
0.0630
0.0262
0.0329
0.0409
0.0505
0.0618
0.0250
0.0314
0,0392
0.9394
0.9505
0.9599
0.9678
0.9744
0.9406
0.9515
0.9608
0.0274
0.0344
0.0233
0.0294
0.0367
0.0455
0.0559
0.9591
0.0427
0.0526
-1.6
-1.5
0.0485
0.0594
0.0475
0.0582
1.8
1.9
0.9641
0.9713
0.9671
0.9738
0.9649
0.9686
0.0668
0.0643
0.0606
0.9719
0.9750
0.0778
0.0934
0.1112
0.1314
0.1539
0.0749
0.0901
0.0808
0,0968
0.1151
0.1357
0.1587
0.0793
0.0951
0.1131
0.1335
0.1562
0.0721
0,0869
0.1038
0.1230
0.1446
0.9778
0.9826
0.9864
0.9896
0.9920
0.9783
0.9830
0.9868
0.9898
0.9922
0.9808
0.9850
0.9884
0.9911
0.9932
0.0764
0.0918
0.0735
0.0885
0.0708
0.0681
0.0823
0,0985
0.1170
0.1379
0.9788
0.9834
0.9871
0.9901
0.9925
0.9798
0.9842
0.9878
0.9906
0.9803
0.9817
-1.4
-1.3
-1.2
-1.1
0.0694
0,0838
0,1003
0,1190
0.1401
2.0
0.9772
0.9793
0.9812
0,0853
0.1020
0.1210
0,1423
0.9838
0.9875
0.9904
0.9927
0.9854
0.9887
0.9913
0.9934
2.1
0.9821
0.9846
0.9857
0.1093
0.1292
0.1515
0.1075
0.1271
0.1492
0.9861
0.9893
0.9918
0.1056
0.9881
0.9909
0.9931
0.9890
0.9916
0.9936
2.2
0.1251
0.1469
2.3
-1.0
2.4
0.9929
-0,9
-0,8
-0.7
-0,6
-0.5
0.1841
02119
02420
0,2743
0.3085
0.1814
0,2090
0.2389
0.2709
0.3050
0.1788
0.2061
0,2358
0.2676
0.1762
0,2033
0,2327
0.2643
0.2981
0.1736
0,2005
0.2296
0,2611
0,2946
0.1711
0.1977
0.2266
0,2578
0.2912
0.1685
0.1949
0.2236
0,2546
0.2877
0.1660
0.1922
0.2206
0.2514
0.2843
0.1635
0.1894
0.2177
0,2483
0.1611
0.1867
0.2148
0.2451
0,2776
2.5
2.6
2.7
2.8
2.9
0.9938
0.9953
0.9965
0.9974
0,9981
0.9940
0.9955
0.9966
0.9975
0,9982
0.9941
0.9956
0.9967
0.9976
0,9982
0.9943
0.9957
0.9968
0.9945
0.9959
0.9969
0.9946
0.9960
0.9970
0.9978
0.9984
0.9948
0.9961
0.9971
0.9979
0.9985
0.9951
0.9963
0.9952
0.9964
0.9974
0.9981
0,9986
0.9949
0.9962
0.9972
0.9979
0,9985
0.9973
0.9980
0.9977
0.9983
0.9977
0.9984
0.3015
0.2810
0.9986
0.3372
0.3745
0.3446
0,3821
0.4207
0.4602
0,5000
0.3228
0.3594
0.3156
0.3520
0,3897
0,4286
0,4681
0.3121
0.3483
0.3859
0.4247
0.4641
-0,4
0.3409
0.3783
0.3336
0.3707
0.3300
0.3669
0.4052
0.3264
0.3632
0.4013
0,4404
0.4801
0.3192
0.3557
0.3936
0.9987
0,9990
0,9993
0,9995
0.9997
0.9987
0.9991
0,9993
0,9995
0.9997
3,0
0.9987
0,9988
0.9988
0.9992
0.9994
0.9996
0.9997
0.9989
0.9989
0.9989
0.9990
0.9990
-0.3
0,9992
0.9994
0.9996
0.9992
0.9995
0.9996
0.9997
0.9993
0.9995
0.4129
0.4522
0.4920
0.4090
0.4483
0.4880
0.3974
0.4364
0.4761
3.1
3.2
3.3
0.9991
0,9994
0,9995
0.9997
0,9991
0.9994
0,9996
0.9992
0.9994
0.9996
0.9997
0.9993
0.9995
0.9996
0.9997
-0,2
0.4168
0.4562
0.4960
0.4443
0.4840
0,4325
0.4721
-0.1
0.9997
0.9998
-0,0
3.4
0.9997
0.9997
Expert Solution
This question has been solved!
Explore an expertly crafted, step-by-step solution for a thorough understanding of key concepts.
This is a popular solution
Trending nowThis is a popular solution!
Step by stepSolved in 2 steps

Knowledge Booster
Similar questions
- Use the normal distribution of SAT critical reading scores for which the mean is 514 and the standard deviation is 115. Assume the variable x is normally distributed. (a) What percent of the SAT verbal scores are less than 650? (b) If 1000 SAT verbal scores are randomly selected, about how many would you expect to be greater than 550? Click to view page 1 of the standard normal table. LOADING... Click to view page 2 of the standard normal table. LOADING... Question content area bottom Part 1 (a) Approximately 1.181.18% of the SAT verbal scores are less than 650. (Round to two decimal places as needed.) Part 2 (b) You would expect that approximately 0.880.88 SAT verbal scores would be greater than 550. (Round to the nearest whole number as needed.)arrow_forwardA normal distribution has a mean of 62 and a standard deviation of 17. What is the median?arrow_forwardCalculate the z-score representing the bottom 10% of an approximately normal distribution. (Use a table or technology. Round your answer to two decimal places.)arrow_forward
- Hi Please help. Thank you. Total cholesterol in children aged 10 to 15 years of age is assume to follow a normal distribution with a mean of 191 and a standard deviation of 22.4. What is the 90 percentile of total cholesterol?arrow_forwardUse the normal distribution of IQ scores , which has a mean of 90 and a standard deviation of 14, and the following table with the standard scores and percentiles for a normal distribution to find the indicated quantity. view the table: Standard Scores and Percentiles for a Normal Distribution (cumulative values from the left) Full data set Open in StatCrunch + Copy to Clipboard + Open in Excel + Standard score % Standard score % minus−3.0 0.13 0.1 53.98 minus−2.5 0.62 0.5 69.15 minus−2 2.28 0.9 81.59 minus−1.5 6.68 1 84.13 minus−1 15.87 1.5 93.32 minus−0.9 18.41 2 97.72 minus−0.5 30.85 2.5 99.38 minus−0.1 46.02 3 99.87 0 50.00 3.5 99.98 The percentage of scores between 62 and 118 is ________%. Round to two decimal places as needed.arrow_forwardThe heights of adult American men can be modeled by a normal distribution with mean μ = 69 inches and standard deviation σ = 2.5 inches. What height is at the 84th percentile of the distribution?Use the empirical rule and do not round your answer.arrow_forward
- Find the ML estimator of the mean and variance from i.i.d. measurements from a normal distribution.arrow_forwardIn an Algebra class, the scores on a test are normally distributed. The middle 68% of the scores fall between 69 and 81. What are the mean and standard deviation for this data? Standard Normal Curve Mean: Standard Deviation:arrow_forwardIf a set of observations is normally distributed, what percent of these differ from the mean by (a) more than 2.20? (b) less than 0.32g? Click here to view page 1 of the standard normal distribution table. Click here to view page 2 of the standard normal distribution table.arrow_forward
arrow_back_ios
arrow_forward_ios
Recommended textbooks for you
 MATLAB: An Introduction with ApplicationsStatisticsISBN:9781119256830Author:Amos GilatPublisher:John Wiley & Sons Inc
 Probability and Statistics for Engineering and th...StatisticsISBN:9781305251809Author:Jay L. DevorePublisher:Cengage Learning
 Statistics for The Behavioral Sciences (MindTap C...StatisticsISBN:9781305504912Author:Frederick J Gravetter, Larry B. WallnauPublisher:Cengage Learning
 Elementary Statistics: Picturing the World (7th E...StatisticsISBN:9780134683416Author:Ron Larson, Betsy FarberPublisher:PEARSON
 The Basic Practice of StatisticsStatisticsISBN:9781319042578Author:David S. Moore, William I. Notz, Michael A. FlignerPublisher:W. H. Freeman
 Introduction to the Practice of StatisticsStatisticsISBN:9781319013387Author:David S. Moore, George P. McCabe, Bruce A. CraigPublisher:W. H. Freeman

MATLAB: An Introduction with Applications
Statistics
ISBN:9781119256830
Author:Amos Gilat
Publisher:John Wiley & Sons Inc

Probability and Statistics for Engineering and th...
Statistics
ISBN:9781305251809
Author:Jay L. Devore
Publisher:Cengage Learning

Statistics for The Behavioral Sciences (MindTap C...
Statistics
ISBN:9781305504912
Author:Frederick J Gravetter, Larry B. Wallnau
Publisher:Cengage Learning

Elementary Statistics: Picturing the World (7th E...
Statistics
ISBN:9780134683416
Author:Ron Larson, Betsy Farber
Publisher:PEARSON

The Basic Practice of Statistics
Statistics
ISBN:9781319042578
Author:David S. Moore, William I. Notz, Michael A. Fligner
Publisher:W. H. Freeman

Introduction to the Practice of Statistics
Statistics
ISBN:9781319013387
Author:David S. Moore, George P. McCabe, Bruce A. Craig
Publisher:W. H. Freeman