MATLAB: An Introduction with Applications
6th Edition
ISBN: 9781119256830
Author: Amos Gilat
Publisher: John Wiley & Sons Inc
expand_more
expand_more
format_list_bulleted
Question

Transcribed Image Text:TO DO: Satu
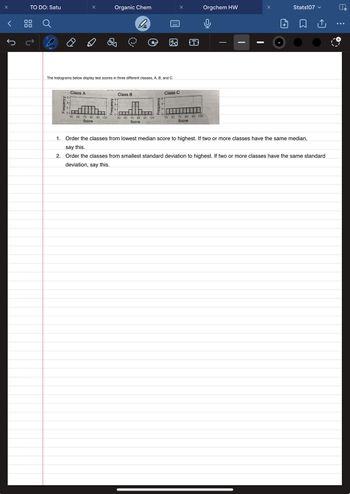
The histograms below display test scores in three different classes, A, B, and C.
Frequency
N
0-
Class A
undan
50 60
70 80 90 100
Score
Organic Chem
be
Frequency
NO
Class B
minent shoy Class C
50 60 70 80 90 100
Score
Frequency
N
x
0-
50 60 70 80
Score
T
90 100
Orgchem HW
abbore
wann
and
x
1+
Stats107 ✓
↑
1. Order the classes from lowest median score to highest. If two or more classes have the same median,
say this.
2. Order the classes from smallest standard deviation to highest. If two or more classes have the same standard
deviation, say this.
...
Expert Solution
This question has been solved!
Explore an expertly crafted, step-by-step solution for a thorough understanding of key concepts.
This is a popular solution
Trending nowThis is a popular solution!
Step by stepSolved in 3 steps

Knowledge Booster
Similar questions
- The table below shows the frequency of AP Biology scores for a high school class. AP Score Frequency 1 5 2 7 3 6 4 4 5 3 Find the mean and median. Mean = 1.67 and Median = 2 Mean = 2.72 and Median = 3 Mean = 2.72 and Median = 7 Mean = 4.53 and Median = 4 Mean = 4.53 and Median = 3arrow_forwardSuppose that a histogram is constructed for the frequency distribution shown below.arrow_forwardThe following frequency table summarizes a set of data. What is the five-number summary? Value Frequency 2 3 3 2 5 1 6 3 7 1 8 2 11 3arrow_forward
- For the sample scores in the frequency distribution table below, the median is 1 4 4. 1 1 1 3.arrow_forwardA study was conducted to examine the impact of speaking in public on college students. A class of 15 statistics students participated in the study. At the beginning of a lecture the students recorded their systolic blood pressure. During the lecture the instructor called on each student to stand and answer questions about topics in the lecture. After speaking the students once again recorded their blood pressure. The resulting values are given below along with summary statistics. before 100 123 128 125 136 108 130 113 105 136 146 138 108 149 132 after 141 142 146 136 144 111 132 114 103 133 140 130 100 133 113 difference -41 -19 -18 -11 -8 -3 -2 -1 2 3 6 8 8 16 19 before after difference mean 125.1 127.9 -2.733 st dev 15.26 15.45 15.23 Does this information indicate that blood pressure increased because of speaking? Conduct an appropriate hypothesis test and show appropriate steps. Let μ1 mean systolic blood pressure before speaking in public, and μ2 mean…arrow_forwardThe table below shows the scores of a group of students on a 10-point quiz. Test Score Frequency 3 1 4 1 7 4 8 4 9. 10 2 The mean score on this test is: The median score on this test is: Check Answerarrow_forward
- Below is a histogram displaying the quiz scores for a class. Choose an estimate for the mean and median that is the best fit for this histogram. Frequency 99 10 20 30 Median 60 and mean - 55 O Median - 70 and mean = 75 O Median 75 and mean 70 Median = 80 and mean = 80 d 40 50 60 70 80 Quiz Score 90 100arrow_forwardThe following data shows the results for 20 students in one of the post graduate unit.42 66 67 71 78 62 61 76 71 6761 64 61 54 83 63 68 69 81 53Based on the information given you are required to Compute the mean, median and mode.arrow_forwardFind the mean of the data summarized in the given frequency distribution table below. Score students 50-59 5 60-69 8 70-79 5 80-89 5 90-99 17arrow_forward
- Consider the following data set: 38 24 32 18 25 Find the 36th percentile for this data. 36th percentile =arrow_forwardThe table below shows the scores of a group of students on a 10-point quiz. Frequency Test Score 3 4 5 6 7 8 9 10 2 3 0 3 3 3 4 4 The mean score on this test is: The median score on this test is:arrow_forward
arrow_back_ios
arrow_forward_ios
Recommended textbooks for you
 MATLAB: An Introduction with ApplicationsStatisticsISBN:9781119256830Author:Amos GilatPublisher:John Wiley & Sons Inc
 Probability and Statistics for Engineering and th...StatisticsISBN:9781305251809Author:Jay L. DevorePublisher:Cengage Learning
 Statistics for The Behavioral Sciences (MindTap C...StatisticsISBN:9781305504912Author:Frederick J Gravetter, Larry B. WallnauPublisher:Cengage Learning
 Elementary Statistics: Picturing the World (7th E...StatisticsISBN:9780134683416Author:Ron Larson, Betsy FarberPublisher:PEARSON
 The Basic Practice of StatisticsStatisticsISBN:9781319042578Author:David S. Moore, William I. Notz, Michael A. FlignerPublisher:W. H. Freeman
 Introduction to the Practice of StatisticsStatisticsISBN:9781319013387Author:David S. Moore, George P. McCabe, Bruce A. CraigPublisher:W. H. Freeman

MATLAB: An Introduction with Applications
Statistics
ISBN:9781119256830
Author:Amos Gilat
Publisher:John Wiley & Sons Inc

Probability and Statistics for Engineering and th...
Statistics
ISBN:9781305251809
Author:Jay L. Devore
Publisher:Cengage Learning

Statistics for The Behavioral Sciences (MindTap C...
Statistics
ISBN:9781305504912
Author:Frederick J Gravetter, Larry B. Wallnau
Publisher:Cengage Learning

Elementary Statistics: Picturing the World (7th E...
Statistics
ISBN:9780134683416
Author:Ron Larson, Betsy Farber
Publisher:PEARSON

The Basic Practice of Statistics
Statistics
ISBN:9781319042578
Author:David S. Moore, William I. Notz, Michael A. Fligner
Publisher:W. H. Freeman

Introduction to the Practice of Statistics
Statistics
ISBN:9781319013387
Author:David S. Moore, George P. McCabe, Bruce A. Craig
Publisher:W. H. Freeman