
MATLAB: An Introduction with Applications
6th Edition
ISBN: 9781119256830
Author: Amos Gilat
Publisher: John Wiley & Sons Inc
expand_more
expand_more
format_list_bulleted
Related questions
Topic Video
Question
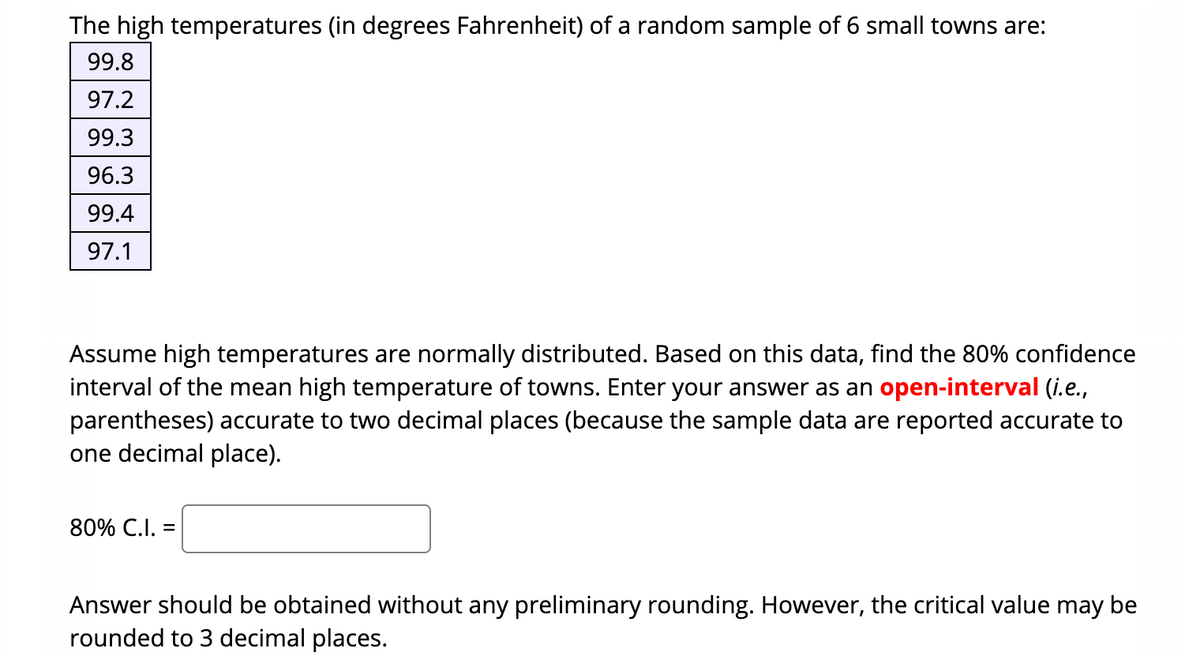

Transcribed Image Text:The high temperatures (in degrees Fahrenheit) of a random sample of 6 small towns are:
99.8
97.2
99.3
96.3
99.4
97.1
Assume high temperatures are normally distributed. Based on this data, find the 80% confidence
interval of the mean high temperature of towns. Enter your answer as an open-interval (i.e.,
parentheses) accurate to two decimal places (because the sample data are reported accurate to
one decimal place).
80% C.I. =
Answer should be obtained without any preliminary rounding. However, the critical value may be
rounded to 3 decimal places.
Expert Solution
This question has been solved!
Explore an expertly crafted, step-by-step solution for a thorough understanding of key concepts.

Step by stepSolved in 2 steps with 2 images

Knowledge Booster


Learn more about
Need a deep-dive on the concept behind this application? Look no further. Learn more about this topic, statistics and related others by exploring similar questions and additional content below.Similar questions
- The 85.7% confidence interval estimate for p was (0.14, 0.16). Find ?′ and ME.arrow_forward10 squirrels were found to have an average weight of 610 grams with a sample standard deviation of 7.75 . Find the 95 % confidence interval of the true mean weight (assume the t-student distribution). A.)(608.25, 614.16) B.)(561.02, 614.16) C.) (604.46,615.54) D.) (513.79, 612.77)arrow_forwardEngineers randomly select 8 of the parachutes and measures the "tearing strengths" of each parachute canopy. The sample mean is 21.7 Newtons, and the standard deviation is 0.23 Newtons. Construct a 99.7% confidence interval for the true mean tearing strength of the parachutes. Round the numbers to 1 decimal place.arrow_forward
- suppose a random sample of 50 basketball players have an average height of 78 inches. Also assume that the population standard deviation is 1.5 inches. I need to Calculate the 99% 95% 90% 80% and 70% confidence interval. The thing is my answers using the formula from class isn't giving me the answers my professor posted.arrow_forwardA 90% confidence interval for p is given as (0.26,0.54). How large was the sample used to construct this interval? (Round up to the nearest observation.)arrow_forwardA random sample of 21 lunch orders at Noodles & Company showed a mean bill of $13.54 with a standard deviation of $6.45. Find the 98 percent confidence interval for the mean bill of all lunch orders. (Round your answers to 4 decimal places.) The 98% confidence interval is from _____to______arrow_forward
- Assume that a sample is used to estimate a population mean. Find the 90% confidence interval for a smaple of size 46 with a mean of 68.5 and a standard deviation of 6.6. Enter the answer as an open-interval (parentheses) accurate to one decimal place (because the sample statistics are reported accurate to one decimal place).arrow_forwardAt a large high school, an assistant principal wants to know how intelligent the students at the school are. An intelligence test is administered to an SRS of 50 students, out of over 2000 students. The mean score was 115 and the standard deviation was 15. Construct a 99% confidence interval for the mean score of all students in the school. A) (109.32, 120.69) B) (119.58, 123.50) C) (110.87, 129.41) D) Can not be determined from the information given.arrow_forwardA clinic measured the systolic blood pressure for a random sample of 10 patients. The resulting 95% confidence interval for the mean systolic blood pressure of all the patients at this clinic was (111.3, 129.5). What was the mean systolic blood pressure from the sample of 10 patients? 18.2 111.3 120.4 129.5arrow_forward
arrow_back_ios
arrow_forward_ios
Recommended textbooks for you
- MATLAB: An Introduction with ApplicationsStatisticsISBN:9781119256830Author:Amos GilatPublisher:John Wiley & Sons Inc
 Probability and Statistics for Engineering and th...StatisticsISBN:9781305251809Author:Jay L. DevorePublisher:Cengage Learning
 Statistics for The Behavioral Sciences (MindTap C...StatisticsISBN:9781305504912Author:Frederick J Gravetter, Larry B. WallnauPublisher:Cengage Learning
  Elementary Statistics: Picturing the World (7th E...StatisticsISBN:9780134683416Author:Ron Larson, Betsy FarberPublisher:PEARSON
 The Basic Practice of StatisticsStatisticsISBN:9781319042578Author:David S. Moore, William I. Notz, Michael A. FlignerPublisher:W. H. Freeman
 Introduction to the Practice of StatisticsStatisticsISBN:9781319013387Author:David S. Moore, George P. McCabe, Bruce A. CraigPublisher:W. H. Freeman
MATLAB: An Introduction with Applications
Statistics
ISBN:9781119256830
Author:Amos Gilat
Publisher:John Wiley & Sons Inc
Probability and Statistics for Engineering and th...
Statistics
ISBN:9781305251809
Author:Jay L. Devore
Publisher:Cengage Learning
Statistics for The Behavioral Sciences (MindTap C...
Statistics
ISBN:9781305504912
Author:Frederick J Gravetter, Larry B. Wallnau
Publisher:Cengage Learning
Elementary Statistics: Picturing the World (7th E...
Statistics
ISBN:9780134683416
Author:Ron Larson, Betsy Farber
Publisher:PEARSON
The Basic Practice of Statistics
Statistics
ISBN:9781319042578
Author:David S. Moore, William I. Notz, Michael A. Fligner
Publisher:W. H. Freeman
Introduction to the Practice of Statistics
Statistics
ISBN:9781319013387
Author:David S. Moore, George P. McCabe, Bruce A. Craig
Publisher:W. H. Freeman