
Glencoe Algebra 1, Student Edition, 9780079039897, 0079039898, 2018
18th Edition
ISBN: 9780079039897
Author: Carter
Publisher: McGraw Hill
expand_more
expand_more
format_list_bulleted
Related questions
Question

Transcribed Image Text:### Analyzing Helicopter Assembly Data for Learning Curve Phenomenon
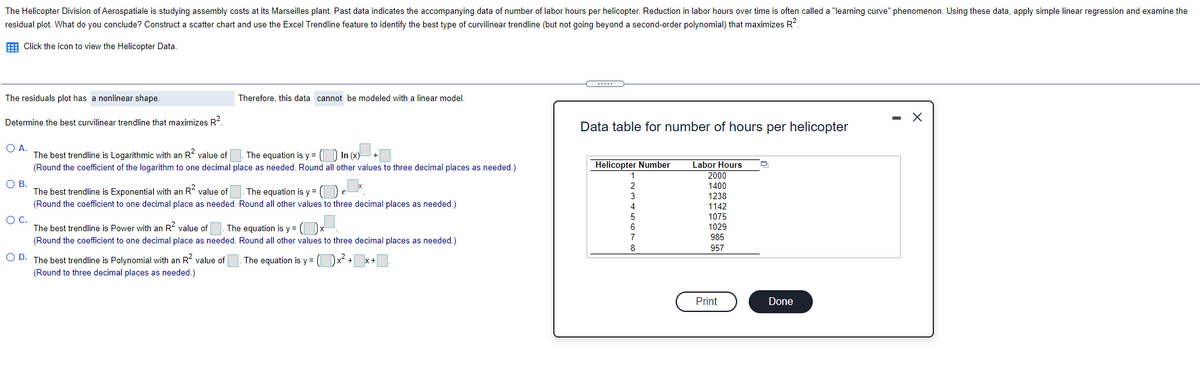
The Helicopter Division of Aerospatiale is examining assembly costs at its Marseilles plant. Historical data show the relationship between the helicopter number and labor hours, suggesting a "learning curve" effect where labor hours decrease over time.
#### Objective
Construct a scatter plot and use Excel's Trendline feature to identify the best curvilinear trendline (not exceeding a second-order polynomial) that maximizes \( R^2 \).
#### Data and Analysis
A table with the number of hours per helicopter is provided:
| Helicopter Number | Labor Hours |
|-------------------|-------------|
| 1 | 2000 |
| 2 | 1400 |
| 3 | 1238 |
| 4 | 1142 |
| 5 | 1075 |
| 6 | 1029 |
| 7 | 965 |
| 8 | 957 |
### Steps for Analysis
1. **Data Visualization**: Construct a scatter plot based on the provided data to visually assess the trend.
2. **Residual Analysis**: Observe the residual plot, which exhibits a nonlinear pattern, suggesting that a linear model is unsuitable.
3. **Model Selection**: Evaluate different trendline models to maximize \( R^2 \).
#### Trendline Options
- **Option A: Logarithmic**
- \( R^2 \) value needed.
- Equation: \( y = a \ln(x) + b \).
- **Option B: Exponential**
- \( R^2 \) value needed.
- Equation: \( y = ae^{bx} \).
- **Option C: Power**
- \( R^2 \) value needed.
- Equation: \( y = ax^b \).
- **Option D: Polynomial (Second-order)**
- \( R^2 \) value needed.
- Equation: \( y = ax^2 + bx + c \).
**Choose the best model** based on the highest \( R^2 \) value after rounding coefficients as specified.
This analysis aids in understanding the reduction in labor hours, indicative of increased efficiency in helicopter production.
Expert Solution
This question has been solved!
Explore an expertly crafted, step-by-step solution for a thorough understanding of key concepts.

This is a popular solution

Trending nowThis is a popular solution!

Step by stepSolved in 2 steps with 4 images

Knowledge Booster

Similar questions
- Does Table 1 represent a linear function? If so, finda linear equation that models the data.arrow_forwardOlympic Pole Vault The graph in Figure 7 indicates that in recent years the winning Olympic men’s pole vault height has fallen below the value predicted by the regression line in Example 2. This might have occurred because when the pole vault was a new event there was much room for improvement in vaulters’ performances, whereas now even the best training can produce only incremental advances. Let’s see whether concentrating on more recent results gives a better predictor of future records. (a) Use the data in Table 2 (page 176) to complete the table of winning pole vault heights shown in the margin. (Note that we are using x=0 to correspond to the year 1972, where this restricted data set begins.) (b) Find the regression line for the data in part ‚(a). (c) Plot the data and the regression line on the same axes. Does the regression line seem to provide a good model for the data? (d) What does the regression line predict as the winning pole vault height for the 2012 Olympics? Compare this predicted value to the actual 2012 winning height of 5.97 m, as described on page 177. Has this new regression line provided a better prediction than the line in Example 2?arrow_forwardWhat does the y -intercept on the graph of a logistic equation correspond to for a population modeled by that equation?arrow_forward
- Tire pressure (psi) and mileage (mpg) were recorded for a random sample of seven cars of thesame make and model. The extended data table (left) and fit model report (right) are based on aquadratic model What is the predicted average mileage at tire pressure x = 31?arrow_forwardOrdinal data cannot be analyzed using regression analysis. True Falsearrow_forwardWhat is Regression Analysis?arrow_forward
arrow_back_ios
arrow_forward_ios
Recommended textbooks for you
- Glencoe Algebra 1, Student Edition, 9780079039897...AlgebraISBN:9780079039897Author:CarterPublisher:McGraw Hill
 Big Ideas Math A Bridge To Success Algebra 1: Stu...AlgebraISBN:9781680331141Author:HOUGHTON MIFFLIN HARCOURTPublisher:Houghton Mifflin Harcourt
 Algebra and Trigonometry (MindTap Course List)AlgebraISBN:9781305071742Author:James Stewart, Lothar Redlin, Saleem WatsonPublisher:Cengage Learning
 College AlgebraAlgebraISBN:9781305115545Author:James Stewart, Lothar Redlin, Saleem WatsonPublisher:Cengage Learning
 Linear Algebra: A Modern IntroductionAlgebraISBN:9781285463247Author:David PoolePublisher:Cengage Learning
Glencoe Algebra 1, Student Edition, 9780079039897...
Algebra
ISBN:9780079039897
Author:Carter
Publisher:McGraw Hill
Big Ideas Math A Bridge To Success Algebra 1: Stu...
Algebra
ISBN:9781680331141
Author:HOUGHTON MIFFLIN HARCOURT
Publisher:Houghton Mifflin Harcourt
Algebra and Trigonometry (MindTap Course List)
Algebra
ISBN:9781305071742
Author:James Stewart, Lothar Redlin, Saleem Watson
Publisher:Cengage Learning
College Algebra
Algebra
ISBN:9781305115545
Author:James Stewart, Lothar Redlin, Saleem Watson
Publisher:Cengage Learning
Linear Algebra: A Modern Introduction
Algebra
ISBN:9781285463247
Author:David Poole
Publisher:Cengage Learning