MATLAB: An Introduction with Applications
6th Edition
ISBN: 9781119256830
Author: Amos Gilat
Publisher: John Wiley & Sons Inc
expand_more
expand_more
format_list_bulleted
Concept explainers
Question
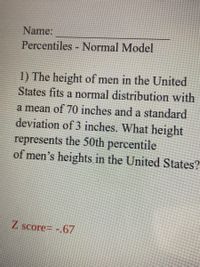
The height of men in the United states fits with a normal distribution with a mean of 70 inches and a standard deviation of 3 inches. What height represents the 50th percentile of men heights in the United states?

Transcribed Image Text:Name:
Percentiles Normal Model
1) The height of men in the United
States fits a normal distribution with
a mean of 70 inches and a standard
deviation of 3 inches. What height
represents the 50th percentile
of men's heights in the United States?
Z score= -.67
Expert Solution
This question has been solved!
Explore an expertly crafted, step-by-step solution for a thorough understanding of key concepts.
This is a popular solution
Trending nowThis is a popular solution!
Step by stepSolved in 2 steps with 2 images

Knowledge Booster
Learn more about
Need a deep-dive on the concept behind this application? Look no further. Learn more about this topic, statistics and related others by exploring similar questions and additional content below.Similar questions
- The distribution of head circumference for full term newborn female infants is approximately normal with a mean of 33.8 cm and a standard deviation of 1.2 cm. For full term newborn female infants, determine the head circumference of a female infant such that 75% of the female infants have their head circumferences less than this female infant. Enter your answer using one decimal place.arrow_forwardAmericans love ice cream .The annual per capita consumption of ice cream ,in pounds ,in the united states can be approximately by a normal distribution with mean 16.5 lbs and standard deviation 2.5 lbs what percent of Americans eat less than 14 lbs of ice cream each year ?arrow_forwardAccording to a recent survey, the salaries of assistant professors have a mean of $40,756 and a standard deviation of $7500 . Assuming that the salaries of assistant professors follow a normal distribution, find the proportion of assistant professors who earn at most $45,000 . Round your answer to at least four decimal places.arrow_forward
- The weekly revenue earned by a certain restaurant has a mean of $118,500 and a standard deviation of $16,800. Determine the 75th percentile of all weekly revenues of this restaurant. Round to the nearest whole number.arrow_forwardA successful basketball player has a height of 6 feet 3 inches, or 191 cm. Based on statistics from a data set, his height converts to the z score of 2.31. How many standard deviations is his height above the mean? standard deviation(s) above the mean. The player's height is (Round to two decimal places as needed.)arrow_forwardIt is a 2 part question. How can we find normality?arrow_forward
- A quantitative data set has a size of 50. At least how many observations lie within seven standard deviations to either side of the mean?arrow_forwardAs a group, the Dutch are among the tallest people in the world. The average Dutch man is 184 cm tall - just over 6 feet. The standard deviation of men's height is about 8 cm. Assuming the distribution is approximately Normal, what fraction of Dutch men should be between 170 cm and 180 cm? type your answer... %arrow_forwardA quantitative data set has mean 19 and standard deviation 2. Approximately what percentage of the observations lie between 17 and 21?arrow_forward
- Identify the data value corresponding to the indicated percentile. The amount of sleep an adult gets per day is normally distributed with a mean of 7 hours and a standard deviation of 1.5 hours. Five percent of adults sleep more than how many hours per day?arrow_forwardIn a recent study, the serum cholesterol levels in men were found to be normally distributed with a mean of 196.7 and a standard deviation of 39.1. Units are in mg/dL. Men who have a cholesterol level that is in the top 2% need regular monitoring by a physician. What is the minimum cholesterol level required to receive the regular monitoring? Round answer to the nearest whole number.arrow_forwardA quantitative data set has size 50. At least how many observations lie within three standard deviations to either side of the mean?arrow_forward
arrow_back_ios
SEE MORE QUESTIONS
arrow_forward_ios
Recommended textbooks for you
 MATLAB: An Introduction with ApplicationsStatisticsISBN:9781119256830Author:Amos GilatPublisher:John Wiley & Sons Inc
 Probability and Statistics for Engineering and th...StatisticsISBN:9781305251809Author:Jay L. DevorePublisher:Cengage Learning
 Statistics for The Behavioral Sciences (MindTap C...StatisticsISBN:9781305504912Author:Frederick J Gravetter, Larry B. WallnauPublisher:Cengage Learning
 Elementary Statistics: Picturing the World (7th E...StatisticsISBN:9780134683416Author:Ron Larson, Betsy FarberPublisher:PEARSON
 The Basic Practice of StatisticsStatisticsISBN:9781319042578Author:David S. Moore, William I. Notz, Michael A. FlignerPublisher:W. H. Freeman
 Introduction to the Practice of StatisticsStatisticsISBN:9781319013387Author:David S. Moore, George P. McCabe, Bruce A. CraigPublisher:W. H. Freeman

MATLAB: An Introduction with Applications
Statistics
ISBN:9781119256830
Author:Amos Gilat
Publisher:John Wiley & Sons Inc

Probability and Statistics for Engineering and th...
Statistics
ISBN:9781305251809
Author:Jay L. Devore
Publisher:Cengage Learning

Statistics for The Behavioral Sciences (MindTap C...
Statistics
ISBN:9781305504912
Author:Frederick J Gravetter, Larry B. Wallnau
Publisher:Cengage Learning

Elementary Statistics: Picturing the World (7th E...
Statistics
ISBN:9780134683416
Author:Ron Larson, Betsy Farber
Publisher:PEARSON

The Basic Practice of Statistics
Statistics
ISBN:9781319042578
Author:David S. Moore, William I. Notz, Michael A. Fligner
Publisher:W. H. Freeman

Introduction to the Practice of Statistics
Statistics
ISBN:9781319013387
Author:David S. Moore, George P. McCabe, Bruce A. Craig
Publisher:W. H. Freeman