MATLAB: An Introduction with Applications
6th Edition
ISBN: 9781119256830
Author: Amos Gilat
Publisher: John Wiley & Sons Inc
expand_more
expand_more
format_list_bulleted
Question
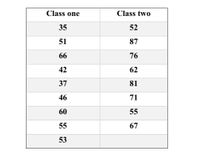
3. The head of the English department is interested in the difference in writing scores between freshman English students who are taught by different teachers. The incoming freshmen are randomly assigned to one of two English teachers and are given a standardized writing test after the first semester. We take a sample of eight students from one class and nine from the other.
a) Is there a difference in achievement on the writing test between the two classes?
b) Give a brief report of your thoughts
Here is the data from the two classes

Transcribed Image Text:Class one
Class two
35
52
51
87
66
76
42
62
37
81
46
71
60
55
55
67
53
Expert Solution
This question has been solved!
Explore an expertly crafted, step-by-step solution for a thorough understanding of key concepts.
This is a popular solution
Trending nowThis is a popular solution!
Step by stepSolved in 2 steps with 2 images

Knowledge Booster
Learn more about
Need a deep-dive on the concept behind this application? Look no further. Learn more about this topic, statistics and related others by exploring similar questions and additional content below.Similar questions
- 600 students at Drew High School were surveyed. 269 of them were males. 455 of the students' wear jewelry, and 300 of the students that wear jewelry are females. 1. Draw a Venn diagram and label the data.arrow_forwardA professor wanted to study the number of hours statistics students spend studyingstatistics each week. Out of 19 statistics sections at Santa Ana College, the professorsurveyed each student from 3 randomly selected sections. What is the largest group ofstudents the results of this study can represent?a. All Santa Ana College studentsb. All Santa Ana College students taking a math classc. All Santa Ana College students taking a statistics classd. Students in the three sections the professor surveyedarrow_forwardIf there are 11 people in the first sample and 10 people in the second sample, the degrees of freedom for the first sample is type your answer... and type your answer... for the second sample.arrow_forward
- Short Answer 3: Thirty students were surveyed as to their ethnicity, and the following was the data: Hisp. White Asian Hisp. Afr. White Afr. Hisp. Asian Hisp. Hisp. White White White Hisp. White Afr. Hisp. Hisp. Hisp. Hisp. White Hisp. White Afr. White Afr. Hisp. White Hisp. Graph a bar chart and a pie chart BY HAND, and upload them to this question using the "File Upload" feature!arrow_forwardA group of 499 students were surveyed about the courses they were taking at their college with the following results:228 students said they were taking Math.213 students said they were taking English.237 students said they were taking History.61 students said they were taking Math and English.84 students said they were taking Math and History.74 students said they were taking English and History.17 students said they were taking all three courses.How many students took Math, English, or History ?arrow_forwardWhat conclusions do you reach from this chart? A. There is an approximately equal percentage of males and females who enjoy shopping for clothing. B. There is a higher percentage of males who enjoy shopping for clothing. C. There is a higher percentage of females who enjoy shopping for clothing. D. The side-by-side bar chart is inconclusive. O A. Yes- No- 0. 100 200 300 400 Frequency Male C Femalearrow_forward
- Please, I want to solve these paragraphs in full, I just want the answerarrow_forwardTwenty students in a group of 40 at Dawn High elect for a course in statistics (St. Eleven students take up linear algebra (L). Five students enrolled for both courses. Represent the data in the Venn diagram below.arrow_forward180 students were surveyed on their current enrollment in Math, Biology, and Chemistry. The results are listed below. 82 students are enrolled in Math. 58 students are enrolled in Biology. 70 students are enrolled in Chemistry. 33 students are enrolled in Math and Bio. 24 students are enrolled in Bio and Chem. 26 students are enrolled in Math and Chem. 14 students are enrolled in all three courses. How many students were enrolled in at least one of the three courses?arrow_forward
arrow_back_ios
arrow_forward_ios
Recommended textbooks for you
 MATLAB: An Introduction with ApplicationsStatisticsISBN:9781119256830Author:Amos GilatPublisher:John Wiley & Sons Inc
 Probability and Statistics for Engineering and th...StatisticsISBN:9781305251809Author:Jay L. DevorePublisher:Cengage Learning
 Statistics for The Behavioral Sciences (MindTap C...StatisticsISBN:9781305504912Author:Frederick J Gravetter, Larry B. WallnauPublisher:Cengage Learning
 Elementary Statistics: Picturing the World (7th E...StatisticsISBN:9780134683416Author:Ron Larson, Betsy FarberPublisher:PEARSON
 The Basic Practice of StatisticsStatisticsISBN:9781319042578Author:David S. Moore, William I. Notz, Michael A. FlignerPublisher:W. H. Freeman
 Introduction to the Practice of StatisticsStatisticsISBN:9781319013387Author:David S. Moore, George P. McCabe, Bruce A. CraigPublisher:W. H. Freeman

MATLAB: An Introduction with Applications
Statistics
ISBN:9781119256830
Author:Amos Gilat
Publisher:John Wiley & Sons Inc

Probability and Statistics for Engineering and th...
Statistics
ISBN:9781305251809
Author:Jay L. Devore
Publisher:Cengage Learning

Statistics for The Behavioral Sciences (MindTap C...
Statistics
ISBN:9781305504912
Author:Frederick J Gravetter, Larry B. Wallnau
Publisher:Cengage Learning

Elementary Statistics: Picturing the World (7th E...
Statistics
ISBN:9780134683416
Author:Ron Larson, Betsy Farber
Publisher:PEARSON

The Basic Practice of Statistics
Statistics
ISBN:9781319042578
Author:David S. Moore, William I. Notz, Michael A. Fligner
Publisher:W. H. Freeman

Introduction to the Practice of Statistics
Statistics
ISBN:9781319013387
Author:David S. Moore, George P. McCabe, Bruce A. Craig
Publisher:W. H. Freeman