A First Course in Probability (10th Edition)
10th Edition
ISBN: 9780134753119
Author: Sheldon Ross
Publisher: PEARSON
expand_more
expand_more
format_list_bulleted
Question

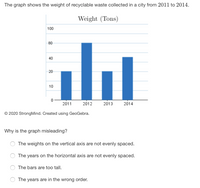
Transcribed Image Text:The graph shows the weight of recyclable waste collected in a city from 2011 to 2014.
Weight (Tons)
100
80
40
20
10
2011
2012
2013
2014
© 2020 StrongMind. Created using GeoGebra.
Why is the graph misleading?
The weights on the vertical axis are not evenly spaced.
The years on the horizontal axis are not evenly spaced.
The bars are too tall.
The years are in the wrong order.
Expert Solution
This question has been solved!
Explore an expertly crafted, step-by-step solution for a thorough understanding of key concepts.
This is a popular solution
Trending nowThis is a popular solution!
Step by stepSolved in 2 steps

Knowledge Booster
Similar questions
- determine the seasonal pattern with the ratio to moving average methodarrow_forwardThe revenue (in dollars) from the sale of a infant car seats is given by R(x) = 70x -0.02x², 0≤x≤ 3500.arrow_forwardUse the border crossings data below and a = = 0.3 and ẞ = 0.2. Truck Crossings Month February 113,691 March 139,204 April 121,498 May 127,511 June 131,500 July 105,245 August 126,606 Copy Data Step 2 of 2: Calculate the adjusted exponential smoothing forecast for September 2011. Assume the forecast component for February 2011 to be the actual truck crossing value minus the initial trend. Let the initial trend be 10,000 trucks. Round your answer to two decimal places.arrow_forward
- For the data set, perform exponential smoothing with alpha = 0.1 to determine the forecast for week 20. week Sales (1000s of gallons) 1 17 2 21 3 19 4 23 5 18 6 16 7 20 8 18 9 22 10 20 11 15 12 22 13 31 14 34 15 31 16 33 17 28 18 32 19 30arrow_forwardSince the discovery of the tiger gar population in Lake Richmond, the population of bluegill fish has also shown significant change: 2016 2017 2018 2019 2020 2021 2,465 2,092 1,783 1,513 1,287 1,094 What is the multiplicative rate of change in the bluegill population?arrow_forwardBelow is data collected over 6 specific years. The data collected is the Consumer Price Index (CPI) and the cost of a slice of tuna. We would like to build a model using the CPI to predict the cost of a slice of pizza in a given year. Year 1960 1973 1986 1995 2002 2003 CPI (x) 30.2 48.3 112.3 162.2 191.9 197.8 Cost of a slice of tuna(y) 0.15 0.35 1.00 1.25 1.75 2.00 Plot the data. Are we justified in creating a Linear Regression model to predict the price of a pizza slice using the CPI? Why or why not? Calculate the descriptive statistics. Calculate the sums of squares Calculate the slope, intercept, and correlation. What is this correlation value telling us? Assemble the prediction equation, and interpret the slope within the context of the problem. State the hypotheses for the hypothesis test for regression.arrow_forward
- A tank is leaking at an increasing rate as indicated by the data below. Use the table to answer the following questions. Time (hr) Leakage (gal/hr) 1 30 2 3 7 8 720 4 65 150 240 290 410 550 650 An upper limit estimate for the amount of material leaked after 4 hours is (Simplify your answer.) gal. A lower limit estimate for the amount of material leaked after 4 hours is gal. (Simplify your answer.) An upper limit estimate for the amount of material leaked after 8 hours is (Simplify your answer.) gal. A lower limit estimate for the amount of material leaked after 8 hours is gal. (Simplify your answer.) If the leakage occurs at a constant rate of 720 gal/hr after 8 hours and the tank initially held 20,000 gallons of material, an estimate for the least amount of time for the tank to empty is hr. (Round to the nearest tenth as needed.) If the leakage occurs at a constant rate of 720 gal/hr after 8 hours and the tank initially held 20,000 gallons of material, an estimate for the most amount…arrow_forwardHow do I graph this?arrow_forwardThe table below is a record of the number of miles driven between stops for gas and the amount of money spent to fill up the gas tank in Audrey’s car over several months. Audrey’s Gas Fill Up LogMiles Driven, x 313 320 341 320 294 348 302Cost to Fill up ($), y 24.80 24.96 25.83 25.17 22.44 27.51 23.93 Step 2 of 2 : If Audrey needs to drive 319 miles home from college and leaves with a full tank, how much should she budget to fill up when she gets home? Assume the regression equation is appropriate for prediction. Round your answer to the nearest cent.arrow_forward
- Assuming equal effort (# of nets in the water has not changed and the fishing season dates have stayed the same) identify trends in the squid population you see in the data. Based on your textbook reading this week, speculate what processes or dynamics could produce the population trends seen in your data.arrow_forward1) Height of Golf Ball Determine the rate of change in the table and identify whether this data is linear, exponential or quadratic. Time (s) Height (ft) 4 1 68 2 100 100 4 68arrow_forwardENERGY (KILOWATT-HOURS) 600 500 400 300 200 400 420 370 0 JAN FEB MAR APR MAY 320 310 330 MONTH -380- JUN JUL AUG SEP 400 420 NOV 580 DEC The line graph shows the monthly consumption of energy in kilowatt-hours for a house during a one-year period. Find the total amount of energy consumed during the year.arrow_forward
arrow_back_ios
SEE MORE QUESTIONS
arrow_forward_ios
Recommended textbooks for you
 A First Course in Probability (10th Edition)ProbabilityISBN:9780134753119Author:Sheldon RossPublisher:PEARSON

A First Course in Probability (10th Edition)
Probability
ISBN:9780134753119
Author:Sheldon Ross
Publisher:PEARSON
