
ENGR.ECONOMIC ANALYSIS
14th Edition
ISBN: 9780190931919
Author: NEWNAN
Publisher: Oxford University Press
expand_more
expand_more
format_list_bulleted
Related questions
Question
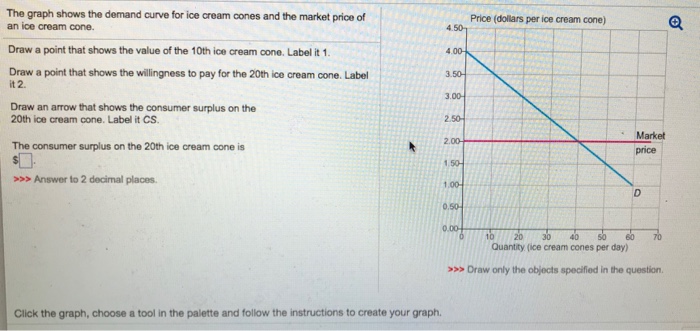

Transcribed Image Text:The image presents a task related to understanding the consumer surplus on the demand curve for ice cream cones. Here's a detailed description:
**Instructions:**
1. **Identify the Value of the 10th Ice Cream Cone:**
- Draw a point that shows the value of the 10th ice cream cone. Label this point "1."
2. **Identify the Willingness to Pay for the 20th Ice Cream Cone:**
- Draw a point that shows the willingness to pay for the 20th ice cream cone. Label this point "2."
3. **Indicate the Consumer Surplus:**
- Draw an arrow that shows the consumer surplus on the 20th ice cream cone. Label this arrow "CS."
4. **Calculate the Consumer Surplus:**
- The consumer surplus on the 20th ice cream cone is represented by the amount in the box with the prompt ">>> Answer to 2 decimal places."
**Graph Explanation:**
- The graph depicts the demand curve for ice cream cones with price (in dollars per ice cream cone) on the y-axis and quantity (ice cream cones per day) on the x-axis.
- A blue demand curve labeled "D" slopes downward, indicating the relationship between the price consumers are willing to pay and the quantity of ice cream cones.
- A horizontal pink line represents the market price.
**Additional Instructions:**
- Follow the prompt below the graph: "Click the graph, choose a tool in the palette and follow the instructions to create your graph."
This task aims to help students learn about consumer surplus related to demand and price.
Expert Solution
This question has been solved!
Explore an expertly crafted, step-by-step solution for a thorough understanding of key concepts.

This is a popular solution

Trending nowThis is a popular solution!

Step by stepSolved in 3 steps with 1 images

Knowledge Booster


Learn more about
Need a deep-dive on the concept behind this application? Look no further. Learn more about this topic, economics and related others by exploring similar questions and additional content below.Similar questions
- 2) The diagram below represents the market for battery packs. If the price were currently at $28/pack there would be a: Group of answer choices surplus of 4 battery packs surplus of 20 battery packs shortage of 4 battery packs shortage of of 20 battery packsarrow_forwardJust complete Question 7A and 7Barrow_forwardA D A 3 Price (dollars per pizza) $406 30 20 0 Figure 4.4.3 50 P HE Reset Selection 100 Refer to Figure 4.4.3 above. When the price of pizza is $30, total expenditure and consumer surplus are, respectively: OA. $1500; $500. 4 OB. $1000; $1000. OC. $1500; $250. D. $1000; $500. D B DI Quantity of pizzas per week 22:01 2020/11/24arrow_forward
- 16. The graph shows the market for sandwiches, and the consumer surplus and producer surplus. 18.00- Price (dollars per sandwich) What is total surplus? Total surplus is $ If the quantity demanded of sandwiches decreases by 120 an hour at each price, the demand curve shifts leftward from Do to D₁. Draw a point at the new equilibrium price and equilibrium quantity. Draw a shape to show the new producer surplus and label it PS. Draw a shape to show the new consumer surplus and label it CS. By how much does total surplus change when demand decreases? 16.00 14.00- 12.00- 10.00- 8.00- 6.00- 4.00- 2.00- Total surplus (1) by $ S D 0.00 0 30 60 90 120 150 180 210 240 270 Quantity (sandwiches per hour) Price (dollars per sandwich) 18.00- 16.00- S 14.00- 12.00- 10.00- 8.00- 6.00- 4.00- 2.00- D₁ Do 0.00 0 30 60 90 120 150 180 210 240 270 Quantity (sandwiches per hour)arrow_forward3. Consumer surplus for a group of consumers The following graph plots the demand curve (blue line) for several consumers in the market for motor scooters in Meade, a small town located in Kansas. The Meade market price of a motor scooter is given by the horizontal black line at $80. Each rectangle you can place on the following graph corresponds to a particular buyer in this market: orange (square symbols) for Dmitri, green (triangle symbols) for Frances, purple (diamond symbols) for Jake, tan (dash symbols) for Latasha, and blue (circle symbols) for Nick. Use the rectangles to shade the areas representing consumer surplus for each person who is willing and able to purchase a motor scooter at a market price of $80. (Note: If a person will not purchase a motor scooter at the market price, indicate this by leaving his or her rectangle in its original position on the palette.) PRICE (Dollars per motor scooter) 160 140 120 Dmitri Frances Jake 100 80 60 40 20 Dmitri Frances Market Price…arrow_forward3. a. Illustrate a demand curve for Chobani Yogurt. Label your axes appropriately. b. The graph below depicts a demand curve. IT c. The graph below depicts a demand curve. Qarrow_forward
- 1. Consider the markets for Streaming Services, Cable TV and Pizza a. Complete the following sentences: Streaming Services and Cable TV are are____________(Complements/Substitutes), but Cable TV and Pizza are _(Complements/Substitutes) b. If the price of Streaming________ (increase/decrease), the price of Cable TV will (increase/decrease), c. If the price of Streaming_____ (increase/decrease the price of Pizza will (increase/decrease) d. Because Streaming and Cable TV are close (Complements/Substitutes), the Demand for Streaming is (Elastic/Inelastic)arrow_forward6. Consumer Surplus Cho buys an iPhone for $240 and gets a consumer surplus of $160. Her willingness to pay for an iPhone is If she had bought the iPhone on sale for $180, her consumer surplus would have been If the price of the iPhone had been $420, her consumer surplus would have been Sarrow_forwardNeha buys an iPhone for $240 and gets a consumer surplus of $160. Her willingness to pay for an iPhone is . If she had bought the iPhone on sale for $180, her consumer surplus would have been . If the price of the iPhone had been $500, her consumer surplus would have beenarrow_forward
- q21- If Amy is willing to pay $800 for a new dress but is able to buy the dress for $600, her consumer surplus is: Select one: a. $600 b. $200 c. $800 d. $1400arrow_forwardPrice $6 5 4 3 2 1 D 10 20 30 40 50 60 Quantity If the price of the good increases from $3 to $4, consumer surplus will decrease by: a. $15 b. $25 c. $20 d. $5 X e. $10arrow_forward8. Total economic surplus The following graph plots the supply and demand curves in the market for VR headsets. Use the black point (plus symbol) to indicate the equilibrium price and quantity of VR headsets. Then use the green point (triangle symbol) to fill the area representing consumer surplus, and use the purple point (diamond symbol) to fill the area representing producer surplus. (?) PRICE (Dollars per headset) 350 315 280 245 210 175 140 105 70 35 0 Demand 0 Supply 40 4 80 120 160 200 240 280 320 360 QUANTITY (Millions of headsets) Total surplus in this market is $ 400 million. Equilibrium A Consumer Surplus ◇ Producer Surplusarrow_forward
arrow_back_ios
SEE MORE QUESTIONS
arrow_forward_ios
Recommended textbooks for you
 Principles of Economics (12th Edition)EconomicsISBN:9780134078779Author:Karl E. Case, Ray C. Fair, Sharon E. OsterPublisher:PEARSON
 Engineering Economy (17th Edition)EconomicsISBN:9780134870069Author:William G. Sullivan, Elin M. Wicks, C. Patrick KoellingPublisher:PEARSON
 Principles of Economics (MindTap Course List)EconomicsISBN:9781305585126Author:N. Gregory MankiwPublisher:Cengage Learning
 Managerial Economics: A Problem Solving ApproachEconomicsISBN:9781337106665Author:Luke M. Froeb, Brian T. McCann, Michael R. Ward, Mike ShorPublisher:Cengage Learning
 Managerial Economics & Business Strategy (Mcgraw-...EconomicsISBN:9781259290619Author:Michael Baye, Jeff PrincePublisher:McGraw-Hill Education
Principles of Economics (12th Edition)
Economics
ISBN:9780134078779
Author:Karl E. Case, Ray C. Fair, Sharon E. Oster
Publisher:PEARSON
Engineering Economy (17th Edition)
Economics
ISBN:9780134870069
Author:William G. Sullivan, Elin M. Wicks, C. Patrick Koelling
Publisher:PEARSON
Principles of Economics (MindTap Course List)
Economics
ISBN:9781305585126
Author:N. Gregory Mankiw
Publisher:Cengage Learning
Managerial Economics: A Problem Solving Approach
Economics
ISBN:9781337106665
Author:Luke M. Froeb, Brian T. McCann, Michael R. Ward, Mike Shor
Publisher:Cengage Learning
Managerial Economics & Business Strategy (Mcgraw-...
Economics
ISBN:9781259290619
Author:Michael Baye, Jeff Prince
Publisher:McGraw-Hill Education