
MATLAB: An Introduction with Applications
6th Edition
ISBN: 9781119256830
Author: Amos Gilat
Publisher: John Wiley & Sons Inc
expand_more
expand_more
format_list_bulleted
Related questions
Question
please dont just say constant decrease. what does the context of that value mean?
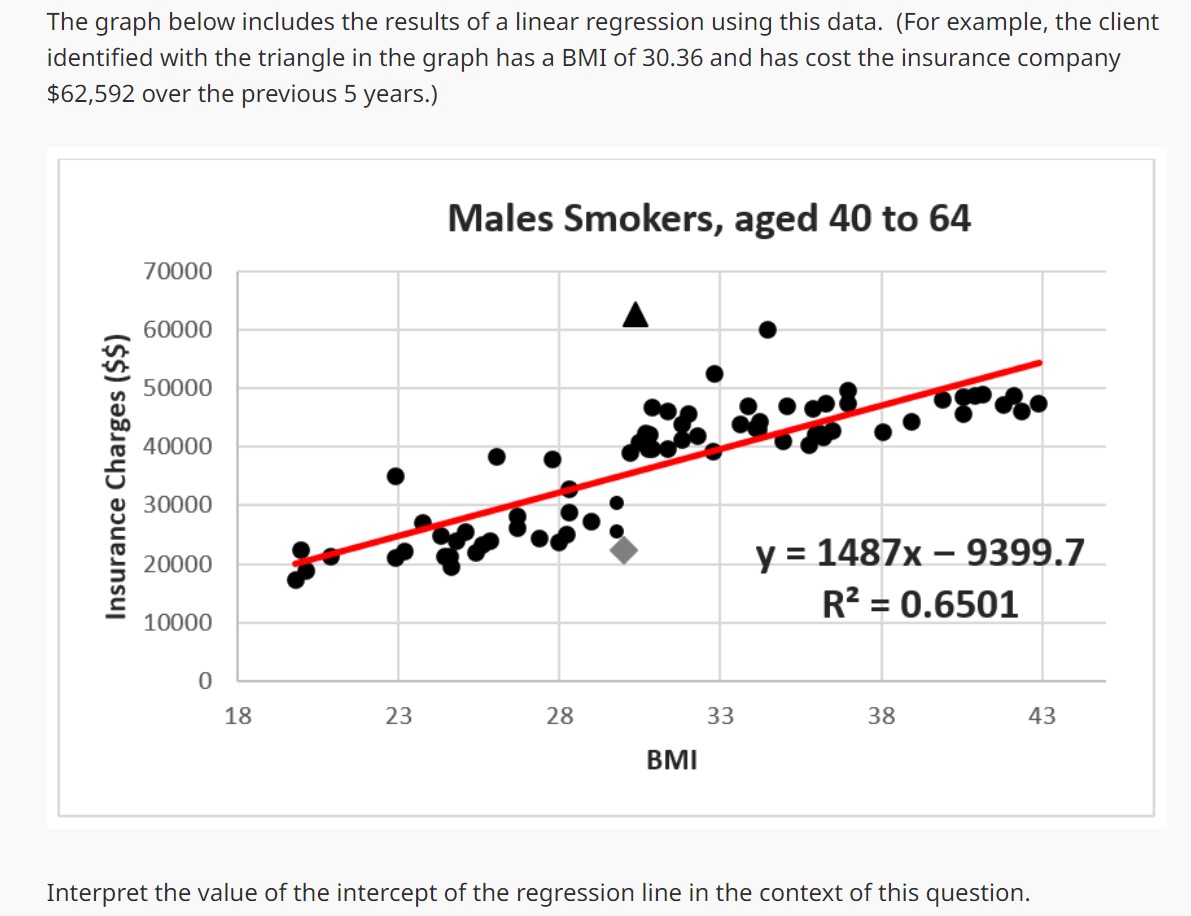

Transcribed Image Text:The graph below includes the results of a linear regression using this data. (For example, the client
identified with the triangle in the graph has a BMI of 30.36 and has cost the insurance company
$62,592 over the previous 5 years.)
Insurance Charges ($$)
70000
60000
50000
40000
30000
20000
10000
0
18
23
Males Smokers, aged 40 to 64
28
wh
BMI
33
y = 1487x - 9399.7
R² = 0.6501
38
43
Interpret the value of the intercept of the regression line in the context of this question.
Expert Solution
This question has been solved!
Explore an expertly crafted, step-by-step solution for a thorough understanding of key concepts.

Step by stepSolved in 3 steps with 14 images

Knowledge Booster

Similar questions
- From your everyday experiences, identify several pairs of variables that appear to be related and might be described by a function. Include at least one pair that does not involve time. For example, when a person has diabetes, the amount of insulin injected and the number of carbs consumed are a pair of variables that are related - the number of carbs consumed is the independent variable and the amount of insulin injected is the dependent variable (the amount of insulin injected depends on the number of carbs that will be or have been consumed).arrow_forwardIm trying to figure out this problum can someone help expain it.arrow_forward***PLEASE INCLUDE EXCEL OUTPUT WITH YOUR RESPONSEarrow_forward
- A downtown parking lot charges $5 per hour for the first 2 hours, then $2.50 per hour after that. Which equation(s) describes the total cost y as a function of the hours x? 1. Y = 5x + 2.5(x-2) 2. Y = 5x + 2.5x 3. Y = 5x for 2 hours or less, then Y =10 + 2.5(x-2) for over 2 hours 4. Y = 5x up to 2 hours then Y = 5x + 2.5x for over 2 hoursarrow_forwardThe length of each YouTube video viewed today. This represents a discrete variable This represents a continuous variablearrow_forwardDr. Suarez, a veterinarian, wants to estimate the average number of calories a Chihuahua normally eats in a day. He will take a sample of n Chihuahuas and create a 99% confidence interval, percent for caloric intake of no more than 10 calories. A pilot study suggests that Chihuahuas' daily has a standard deviation of 36 calories. Which of these is the smallest approximate sample size required to obtain the desired margin of error Select one: a.86 b.68 c.50 d.36 e.30arrow_forward
- 23. TV sets: A Nielsen Company report states that the mean number of TV sets in a U.S. household is 2.24. Assume the standard deviation is 1.2. A sample of 85 households is drawn. a. What is the probability that the sample mean number of TV sets is greater than 2? b. What is the probability that the sample mean number of TV sets is between 2.5 and 3? c. Find the 30th percentile of the sample mean. d. Would it be unusual for the sample mean to be less than 2? e. Can you tell whether it would be unusual for an individual household to have fewer than 2 TV sets? Explain.arrow_forwardthe operating expesnes of amazon increased from 3.6 billion in 2008 to 16.3 billion in 2012. use the information to find a linear model for amazons operating expesne E as a function of time t in years since 2010arrow_forwardIs the independent variable of a function associated with the domain or range? Is the dependent variable associated with the domain or range?arrow_forward
- Does the function y = x3 ever have a negative slope? If so, where? Justify your answer.arrow_forwardplease help mearrow_forward3. The function y= 2x² is translated 1 unit to the right and 4 units down. The new function can be written and simplified in the form y=ax²-bx-c. Record the value of "a" in the first box. Record the value of "b" in the second box. Record the value of "e" in the third box. My answer: My confidence level: 1-2-3-4-5 The correct answer:arrow_forward
arrow_back_ios
SEE MORE QUESTIONS
arrow_forward_ios
Recommended textbooks for you
- MATLAB: An Introduction with ApplicationsStatisticsISBN:9781119256830Author:Amos GilatPublisher:John Wiley & Sons Inc
 Probability and Statistics for Engineering and th...StatisticsISBN:9781305251809Author:Jay L. DevorePublisher:Cengage Learning
 Statistics for The Behavioral Sciences (MindTap C...StatisticsISBN:9781305504912Author:Frederick J Gravetter, Larry B. WallnauPublisher:Cengage Learning
  Elementary Statistics: Picturing the World (7th E...StatisticsISBN:9780134683416Author:Ron Larson, Betsy FarberPublisher:PEARSON
 The Basic Practice of StatisticsStatisticsISBN:9781319042578Author:David S. Moore, William I. Notz, Michael A. FlignerPublisher:W. H. Freeman
 Introduction to the Practice of StatisticsStatisticsISBN:9781319013387Author:David S. Moore, George P. McCabe, Bruce A. CraigPublisher:W. H. Freeman
MATLAB: An Introduction with Applications
Statistics
ISBN:9781119256830
Author:Amos Gilat
Publisher:John Wiley & Sons Inc
Probability and Statistics for Engineering and th...
Statistics
ISBN:9781305251809
Author:Jay L. Devore
Publisher:Cengage Learning
Statistics for The Behavioral Sciences (MindTap C...
Statistics
ISBN:9781305504912
Author:Frederick J Gravetter, Larry B. Wallnau
Publisher:Cengage Learning
Elementary Statistics: Picturing the World (7th E...
Statistics
ISBN:9780134683416
Author:Ron Larson, Betsy Farber
Publisher:PEARSON
The Basic Practice of Statistics
Statistics
ISBN:9781319042578
Author:David S. Moore, William I. Notz, Michael A. Fligner
Publisher:W. H. Freeman
Introduction to the Practice of Statistics
Statistics
ISBN:9781319013387
Author:David S. Moore, George P. McCabe, Bruce A. Craig
Publisher:W. H. Freeman