
Related questions
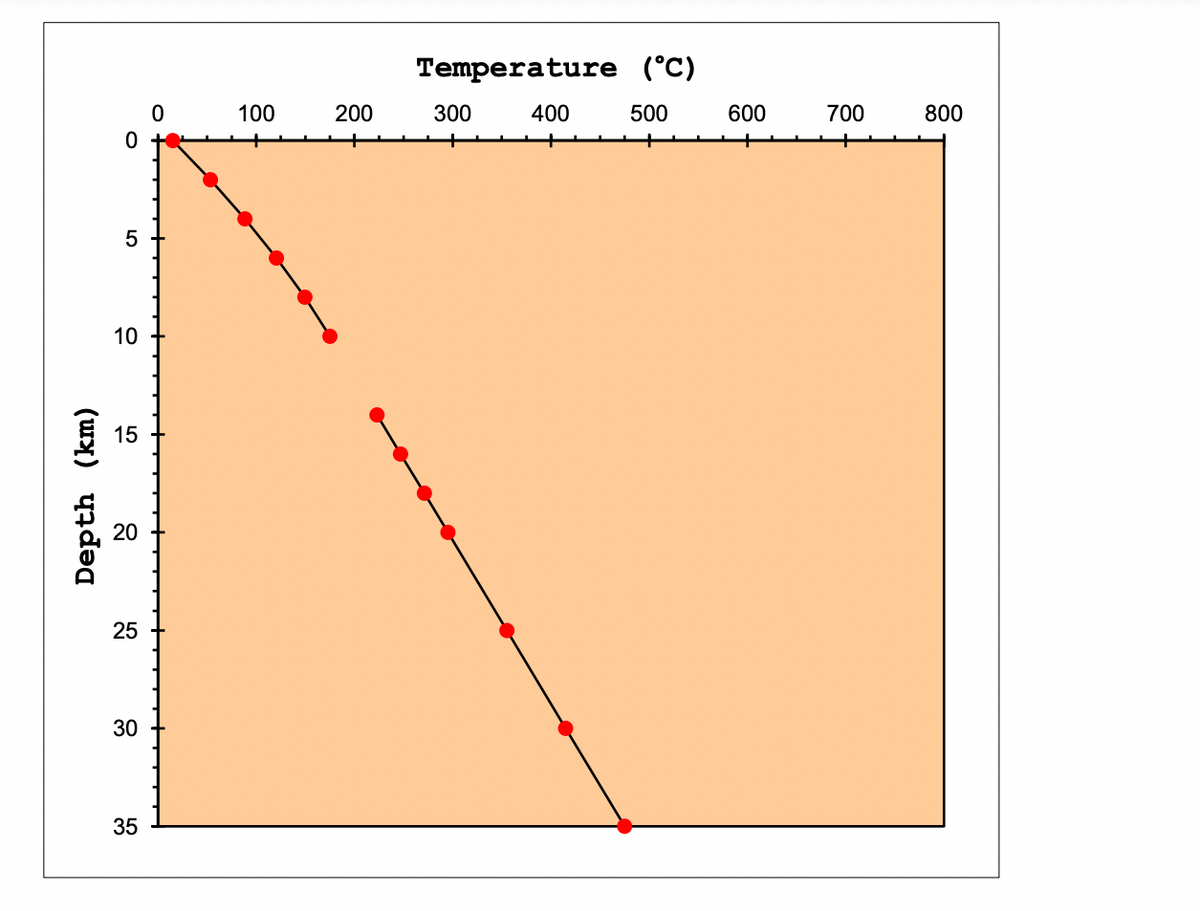
The Graph below (Graph 1) shows a plot of the Geothermal Gradient for a section of the Earth. Note that the “X” axis (the Horizontal axis) plots the Temperature of the Earth. The “Y” axis (the Vertical axis) plots the Depth of the Earth. When ‘reading’ this graph start at the Upper left hand corner. Since we are ‘imagining’ that we are going deeper and deeper down into the Earth (towards the Core), we start with the “0” (Zero) value in the Upper left hand corner of the “Y” axis and ‘count’ values downward. (This is opposite to how you would normally read a graph!)
10)Graph 1 shows the Geothermal gradient for the following sections of the Earth.
a) Oceanic and Continental Crust
b) Lower and Upper Mantle
c) Inner and Outer Core
d) Core and Mantle ONLY
e) Mantle and Crust ONLY
11)Complete this sentence. From 20 km to 35 km the temperature is plotted vs Depth. The depth is plotted at an interval of every (km)
a) 1 km
b) 2 km
c) 3 km
d) 5 km
e) 10 km
12)Examine the red plotted points on Graph 1. What is the temperature at 20 km?
a) 25 to 35 °C
b) 100 °C (the boiling point of water)
c) 290 to 300 °C
d) 295 to 310 Kelvin
e) 775 to 800 °C
13)Examine the red plotted points on Graph 1 and the trend of the plotted points. Notice that one of the points at the depth of 12 km is missing. What would you estimate the Geothermal gradient temperature to be at the 12 km depth?
a) 20 to 30 °C
b) 195 to 205 °C
c) 200 to 210 Kelvin
d) 450 to 460 °F
e) 755 to 765 °C


Trending nowThis is a popular solution!

Step by stepSolved in 2 steps


- Applications and Investigations in Earth Science ...Earth ScienceISBN:9780134746241Author:Edward J. Tarbuck, Frederick K. Lutgens, Dennis G. TasaPublisher:PEARSON
 Exercises for Weather & Climate (9th Edition)Earth ScienceISBN:9780134041360Author:Greg CarbonePublisher:PEARSON
 Environmental ScienceEarth ScienceISBN:9781260153125Author:William P Cunningham Prof., Mary Ann Cunningham ProfessorPublisher:McGraw-Hill Education
  Earth Science (15th Edition)Earth ScienceISBN:9780134543536Author:Edward J. Tarbuck, Frederick K. Lutgens, Dennis G. TasaPublisher:PEARSON
 Environmental Science (MindTap Course List)Earth ScienceISBN:9781337569613Author:G. Tyler Miller, Scott SpoolmanPublisher:Cengage Learning
 Physical GeologyEarth ScienceISBN:9781259916823Author:Plummer, Charles C., CARLSON, Diane H., Hammersley, LisaPublisher:Mcgraw-hill Education,