MATLAB: An Introduction with Applications
6th Edition
ISBN: 9781119256830
Author: Amos Gilat
Publisher: John Wiley & Sons Inc
expand_more
expand_more
format_list_bulleted
Question

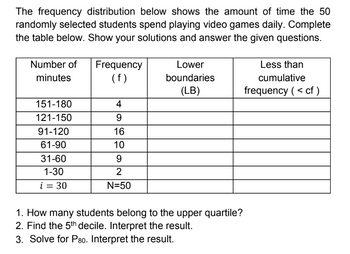
Transcribed Image Text:The frequency distribution below shows the amount of time the 50
randomly selected students spend playing video games daily. Complete
the table below. Show your solutions and answer the given questions.
Number of Frequency
minutes
(f)
Lower
boundaries
(LB)
Less than
cumulative
frequency (< cf)
151-180
4
121-150
9
91-120
16
61-90
10
31-60
9
1-30
2
i = 30
N=50
1. How many students belong to the upper quartile?
2. Find the 5th decile. Interpret the result.
3. Solve for P80. Interpret the result.
Expert Solution
This question has been solved!
Explore an expertly crafted, step-by-step solution for a thorough understanding of key concepts.
This is a popular solution
Trending nowThis is a popular solution!
Step by stepSolved in 5 steps

Knowledge Booster
Similar questions
- Allie has 5 exam scores 98, 94, 84, 95 and 95 in math class. What score does she need on the final to have a mean grade of 90? Round answer two decimal places if necessary. All exams have a maximum of 100 points.arrow_forwardWhat is the median rain intensity is? Can you please explain how to get the median.arrow_forwardThe data set below provides the time 10 adults spent in their car traveling to and from work. Here are the results in hours: 10,3,13,9,9,12,15,14,5,13 -Find the mean of the data setarrow_forward
- identify the Cummulative Frequency Distribution Scores Number of Students 50-59 2 60-69 4 70-79 6 80-89 15 90-99 5arrow_forwardPlease answer the question in the photo. TY!arrow_forwardUsing the data given below, determine whether it would unusual for a household to have no HD televisions. The number of televisions (HD) per household in a small town Televisions 0 3 Households P(x) 52 0.020 465 0.179 Choose the correct answer below. 668 0.257 0.544 ELE OA. It would not be unusual because 52 people have no HD televisions in the town. OB. It would not be unusual because the probability of having no HD televisions is more than 0.05. OC. It would be unusual because 52 people have no HD televisions in the town. OD. It would be unusual because the probability of having no HD televisions is less than 0.05. DA LL ^ mmmmmmm Next delivery Order: V4022851202-HEZHYAWHCL Purchase date: Oct 11, 2022 Your package arrives Wednesday, October 12 Hi R... ation for Supper Club on Thursday, October 13, 2022, 9:00 PM Supper Club Reservation cancelled Your reservation has been... Tock Llc Tock Llc Chicago, IL $52.25 Pending Amount $52.25 Source Cash Card 11 11 10: 10: 781- Ос Oct Oct Oct…arrow_forward
- The first picture is the question and the second is the ones that I need help with. Thanksarrow_forwardI need help with this question.arrow_forwardCreate a histogram for each of your variables using the same classes that you used for your frequency table. Discuss the distribution of each histogram. Based on the shape of each histogram, would the mean or median be a better measure of center for each variable? Explain.The graphs go up by 2.5. male stats: mean-18.1667 standard deviation-2.7796 N-183 female stats: mean-20.8973 standard deviation-3.3859 N-183arrow_forward
- The table shows their exam1 and exam2 scores. Question: The mean of exam2 is 65. Then, what is Peter’s exam2 score? Answer with ONE decimal digit.arrow_forwardDerrick is preparing to submit his taxes. Over the year, he kept track of certain deductions he is able to claim (all rounded to the nearest dollar). These values are given below. 65,144,97,144,103,98,101,127,58,151 He wants to create a histogram of the data using 4 classes. What values of Xscl, Xmin, and Xmax should he use?arrow_forwardAnswer it correctly please. I ll rate accordingly with multiple votes. Explain well and Typed answer only.arrow_forward
arrow_back_ios
SEE MORE QUESTIONS
arrow_forward_ios
Recommended textbooks for you
 MATLAB: An Introduction with ApplicationsStatisticsISBN:9781119256830Author:Amos GilatPublisher:John Wiley & Sons Inc
 Probability and Statistics for Engineering and th...StatisticsISBN:9781305251809Author:Jay L. DevorePublisher:Cengage Learning
 Statistics for The Behavioral Sciences (MindTap C...StatisticsISBN:9781305504912Author:Frederick J Gravetter, Larry B. WallnauPublisher:Cengage Learning
 Elementary Statistics: Picturing the World (7th E...StatisticsISBN:9780134683416Author:Ron Larson, Betsy FarberPublisher:PEARSON
 The Basic Practice of StatisticsStatisticsISBN:9781319042578Author:David S. Moore, William I. Notz, Michael A. FlignerPublisher:W. H. Freeman
 Introduction to the Practice of StatisticsStatisticsISBN:9781319013387Author:David S. Moore, George P. McCabe, Bruce A. CraigPublisher:W. H. Freeman

MATLAB: An Introduction with Applications
Statistics
ISBN:9781119256830
Author:Amos Gilat
Publisher:John Wiley & Sons Inc

Probability and Statistics for Engineering and th...
Statistics
ISBN:9781305251809
Author:Jay L. Devore
Publisher:Cengage Learning

Statistics for The Behavioral Sciences (MindTap C...
Statistics
ISBN:9781305504912
Author:Frederick J Gravetter, Larry B. Wallnau
Publisher:Cengage Learning

Elementary Statistics: Picturing the World (7th E...
Statistics
ISBN:9780134683416
Author:Ron Larson, Betsy Farber
Publisher:PEARSON

The Basic Practice of Statistics
Statistics
ISBN:9781319042578
Author:David S. Moore, William I. Notz, Michael A. Fligner
Publisher:W. H. Freeman

Introduction to the Practice of Statistics
Statistics
ISBN:9781319013387
Author:David S. Moore, George P. McCabe, Bruce A. Craig
Publisher:W. H. Freeman