
MATLAB: An Introduction with Applications
6th Edition
ISBN: 9781119256830
Author: Amos Gilat
Publisher: John Wiley & Sons Inc
expand_more
expand_more
format_list_bulleted
Related questions
Question
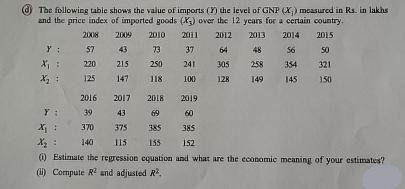

Transcribed Image Text:The following table shows the value of imports (7) the level of GNP (X;) measured in Rs. in lakhs
and the price index of imported goods (X₂) over the 12 years for a certain country.
2008
2009 2010
2011 2012
2013 2014
2015
43
73
37
64
48
50
215
250
241 305
258
321
147
118
100
128
149
150
Y
X₁
x₂
=
57
220
125
56
354
145
2016 2017
2018
2019
Y:
39
43
69
60
X₁:
370
375
385
385
X₂: 140 115
155
152
(1) Estimate the regression equation and what are the economic meaning of your estimates?
(1) Compute R² and adjusted R2.
Expert Solution
This question has been solved!
Explore an expertly crafted, step-by-step solution for a thorough understanding of key concepts.

Step by stepSolved in 4 steps with 1 images

Knowledge Booster

Similar questions
- Which of the following sets of data represent valid functions? OS = {(0, – 1), (3, 1), (6, 4), (7, 9), (13, 14)} || OF = {(- 3, – 2), (1, 2), (1, 4), (8, 9), (13, 15)} OR = {(-1, - 2), (2, 1), (4, 5), ( – 1, – 2), (10, 13)} | OG = {(- 4, - 5), (2, 3), (4, 5), (9, 8), (14, 10)} Calculator Check Answer MacBook Airarrow_forwardAn economist at Nedbank ran a study of the relationship between FTSE/JSE All Shares index return (JALSH) and consumer price index (CPI) from 2006 to 2017, the data collected is shown in the Table 1 below. FTSE/JSE All Shares index return (JALSH) and consumer price index (CPI) from 2006 to 2017. Year JALSH (Y) CPI (X) 2006 0.41 4.7 2007 0.19 7.1 2008 -0.23 11.5 2009 0.32 7.1 2010 0.19 4.3 2011 0.03 5.0 2012 0.27 5.6 2013 0.21 5.7 2014 0.11 6.1 2015 0.05 4.6 2016 0.00 6.4 2017 0.21 5.3 The estimated regression…arrow_forward
Recommended textbooks for you
- MATLAB: An Introduction with ApplicationsStatisticsISBN:9781119256830Author:Amos GilatPublisher:John Wiley & Sons Inc
 Probability and Statistics for Engineering and th...StatisticsISBN:9781305251809Author:Jay L. DevorePublisher:Cengage Learning
 Statistics for The Behavioral Sciences (MindTap C...StatisticsISBN:9781305504912Author:Frederick J Gravetter, Larry B. WallnauPublisher:Cengage Learning
  Elementary Statistics: Picturing the World (7th E...StatisticsISBN:9780134683416Author:Ron Larson, Betsy FarberPublisher:PEARSON
 The Basic Practice of StatisticsStatisticsISBN:9781319042578Author:David S. Moore, William I. Notz, Michael A. FlignerPublisher:W. H. Freeman
 Introduction to the Practice of StatisticsStatisticsISBN:9781319013387Author:David S. Moore, George P. McCabe, Bruce A. CraigPublisher:W. H. Freeman
MATLAB: An Introduction with Applications
Statistics
ISBN:9781119256830
Author:Amos Gilat
Publisher:John Wiley & Sons Inc
Probability and Statistics for Engineering and th...
Statistics
ISBN:9781305251809
Author:Jay L. Devore
Publisher:Cengage Learning
Statistics for The Behavioral Sciences (MindTap C...
Statistics
ISBN:9781305504912
Author:Frederick J Gravetter, Larry B. Wallnau
Publisher:Cengage Learning
Elementary Statistics: Picturing the World (7th E...
Statistics
ISBN:9780134683416
Author:Ron Larson, Betsy Farber
Publisher:PEARSON
The Basic Practice of Statistics
Statistics
ISBN:9781319042578
Author:David S. Moore, William I. Notz, Michael A. Fligner
Publisher:W. H. Freeman
Introduction to the Practice of Statistics
Statistics
ISBN:9781319013387
Author:David S. Moore, George P. McCabe, Bruce A. Craig
Publisher:W. H. Freeman