
ENGR.ECONOMIC ANALYSIS
14th Edition
ISBN: 9780190931919
Author: NEWNAN
Publisher: Oxford University Press
expand_more
expand_more
format_list_bulleted
Related questions
Question
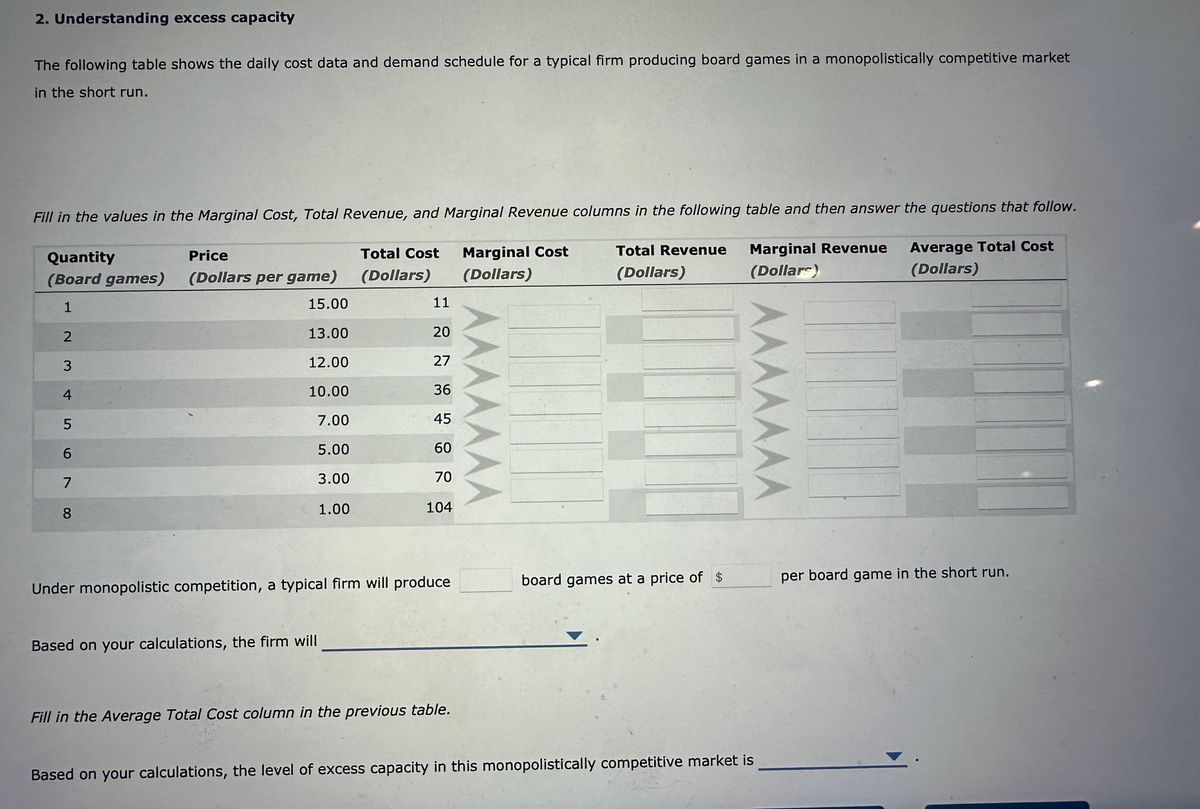

Transcribed Image Text:2. Understanding excess capacity
The following table shows the daily cost data and demand schedule for a typical firm producing board games in a monopolistically competitive market
in the short run.
Fill in the values in the Marginal Cost, Total Revenue, and Marginal Revenue columns in the following table and then answer the questions that follow.
Total Cost
(Dollars)
Total Revenue
(Dollars)
Quantity
(Board games)
1
2
3
4
5600
7
8
Price
(Dollars per game)
15.00
13.00
12.00
10.00
7.00
5.00
3.00
1.00
Based on your calculations, the firm will
11
20
27
36
45
60
70
104
Under monopolistic competition, a typical firm will produce
Fill in the Average Total Cost column in the previous table.
Marginal Cost
(Dollars)
AAAAAAA
board games at a price of $
Marginal Revenue
(Dollars)
AAAAAAA
Based on your calculations, the level of excess capacity in this monopolistically competitive market is
Average Total Cost
(Dollars)
per board game in the short run.
Expert Solution
This question has been solved!
Explore an expertly crafted, step-by-step solution for a thorough understanding of key concepts.

This is a popular solution

Trending nowThis is a popular solution!

Step by stepSolved in 3 steps with 5 images

Knowledge Booster

Similar questions
- The table shows the costs and revenue for Glitter Ltd., a monopolistic competitor that sells earrings. Calculate the missing values in the table to the nearest whole number.arrow_forwardAs an entrepreneur, which graph illustrates the ideal brand loyalty you would like to see for your product, that is, the demand curve you would like to achieve as closely as possible? Product A Product B Price Demand Graph A Graph B Graph C Graph D Quantity Price Demand Quantity Price Product C Demand Quantity Price Product D Demand Quantityarrow_forwardThe Taco Bus Low Price High Price The Fajita Wagon Low Price Taco Bus: $1,000 Taco Bus: $500 Fajita Wagon: $1,000 Fajita Wagon: $6,000 High Price Taco Bus: $6,000 Taco Bus: $4,000 Fajita Wagon: $500 Fajita Wagon: $4,000 Refer to the table above, which describes the payoffs to different pricing strategies for a duopoly. What set of strategies would be the Nash equilibrium for this game? The Fajita Wagon adopts a high price, and the Taco Bus adopts a high price. The Fajita Wagon earns $1,000 profit, and the Taco Bus earns $1,000 profit. The Fajita Wagon earns $4,000 profit, and the Taco Bus earns $4,000 profit. The Fajita Wagon adopts a low price, and the Taco Bus adopts a low price. There is no Nash equilibrium in this game.arrow_forward
- If the price is greater than Actual total cost, does the monopolistic firm makes a profit, loss, or break-even?arrow_forwardA perfectly competitive firm is expected to make a $0 economic profit in the long-run. What type(s) of profit would you expect a monopolist to earn in the long-run? Why the difference? Use the editor to format your answerarrow_forwardWhich of the markets is the best example of monopolistic competition? the market for sugar snap peas the market for cola the fast food industry O your town's utilities distrubutor(s) of electricity and water 46°Farrow_forward
- There are two groups of firms below. Group 1: firms in the retail sector (e.g. Amazon; Wal-Mart; Target; Kohl's; Sears; Macy's) Group 2: firms in the wireless services industry (e.g. Verizon; AT & T; Sprint/T-Mobile) (this about telecommunication services, not about the sale of phones) For each group determine and explain if the group is monopolistic competitive or an oligopoly. You need to specific for both in which market structure the firms operate) Then choose one of the firms from one group. Using a Porter's analysis what are the threat to profitability?arrow_forwardwhat market inefficiencies derive from monopolies and monopolistic competition?arrow_forwardThe diagram at right shows the structure of cost and demand facing a monopolistically competitive firm in the short run. The profit-maximizing output level is units of output. (Enter your response as an integer.) The profit-maximizing price is $. (Enter your response as an integer.) Total revenue is $ (Enter your response as an integer.) Total cost is $. (Enter your response as an integer.) Total profit or loss is $ (Enter your response as an integer and include a negative sign where appropriate.) In the long run, firms will OA. exit, shifting the demand facing the remaining firms to the right until the firms earn an economic profit. B. exit, shifting the demand facing the remaining firms to the right until the firms earn a normal profit. OC. enter, shifting the demand facing the remaining firms to the left until the firms earn a normal profit. OD. enter, shifting the demand facing the remaining firms to the left until the firms earn an economic profit. $14 $13 $12 $11 $7 MR 15 20…arrow_forward
- PTICE and COST $40 30 23 20 10 MC ATC ATC MR AR=D 150 200 Quantity per day 0:13 Question 11 (10 points) (Exhibit: Profit Maximization for a Firm in Monopolistic Competition) Suppose that an innovation reduces a firm's fixed costs and reduces cost from ATC to ATC' Before the innovation reduced the cost, the firm's maximum economic profit was: $0. $30. $750. $4,500.arrow_forwardThe diagram above represents a monopolistically competitive firm. Answer the questions below. Is this firm operating in the short-run or long-run? How do you know? Calculate this firm’s accounting profit. From the diagram, what is the productively efficient output for this firm? From the diagram, economies of scale are maximized at which output level? Explain. From the diagram, what is the allocatively efficient output for this firm? Explain.arrow_forwardThe following graph shows the daily demand curve for bippitybops in Chicago. Use the green rectangle (triangle symbols) to compute total revenue at various prices along the demand curve. Note: You will not be graded on any changes made to this graph. Total Revenue 0 8 16 24 32 40 48 56 64 72 80 200 180 160 140 120 100 80 60 40 20 0 PRICE (Dollars per bippitybop) QUANTITY (Bippitybops per day) Demand A B Area: 1280 Calculate the daily total revenue when the market price is $180, $160, $140, $120, $100, $80, $60, and $40 per bippitybop. Then, use the green point (triangle symbol) to plot the daily total revenue against quantity corresponding to these market prices on the following graph. Total Revenue 0 8 16 24 32 40 48 56 64 72 80 3840 3520 3200 2880 2560 2240 1920 1600 1280 960 640 320 0 TOTAL REVENUE (Dollars) QUANTITY (Bippitybops per day) According to the midpoints formula, the price elasticity of demand between points A and B on the initial graph is approximately . Suppose the…arrow_forward
arrow_back_ios
SEE MORE QUESTIONS
arrow_forward_ios
Recommended textbooks for you
 Principles of Economics (12th Edition)EconomicsISBN:9780134078779Author:Karl E. Case, Ray C. Fair, Sharon E. OsterPublisher:PEARSON
 Engineering Economy (17th Edition)EconomicsISBN:9780134870069Author:William G. Sullivan, Elin M. Wicks, C. Patrick KoellingPublisher:PEARSON
 Principles of Economics (MindTap Course List)EconomicsISBN:9781305585126Author:N. Gregory MankiwPublisher:Cengage Learning
 Managerial Economics: A Problem Solving ApproachEconomicsISBN:9781337106665Author:Luke M. Froeb, Brian T. McCann, Michael R. Ward, Mike ShorPublisher:Cengage Learning
 Managerial Economics & Business Strategy (Mcgraw-...EconomicsISBN:9781259290619Author:Michael Baye, Jeff PrincePublisher:McGraw-Hill Education
Principles of Economics (12th Edition)
Economics
ISBN:9780134078779
Author:Karl E. Case, Ray C. Fair, Sharon E. Oster
Publisher:PEARSON
Engineering Economy (17th Edition)
Economics
ISBN:9780134870069
Author:William G. Sullivan, Elin M. Wicks, C. Patrick Koelling
Publisher:PEARSON
Principles of Economics (MindTap Course List)
Economics
ISBN:9781305585126
Author:N. Gregory Mankiw
Publisher:Cengage Learning
Managerial Economics: A Problem Solving Approach
Economics
ISBN:9781337106665
Author:Luke M. Froeb, Brian T. McCann, Michael R. Ward, Mike Shor
Publisher:Cengage Learning
Managerial Economics & Business Strategy (Mcgraw-...
Economics
ISBN:9781259290619
Author:Michael Baye, Jeff Prince
Publisher:McGraw-Hill Education