
MATLAB: An Introduction with Applications
6th Edition
ISBN: 9781119256830
Author: Amos Gilat
Publisher: John Wiley & Sons Inc
expand_more
expand_more
format_list_bulleted
Related questions
Question
(a) What is the level of significance?
(b) Find the value of the chi-square statistic for the sample. (Round the expected frequencies to at least three decimal places. Round the test statistic to three decimal places.
What are the degrees of freedom?
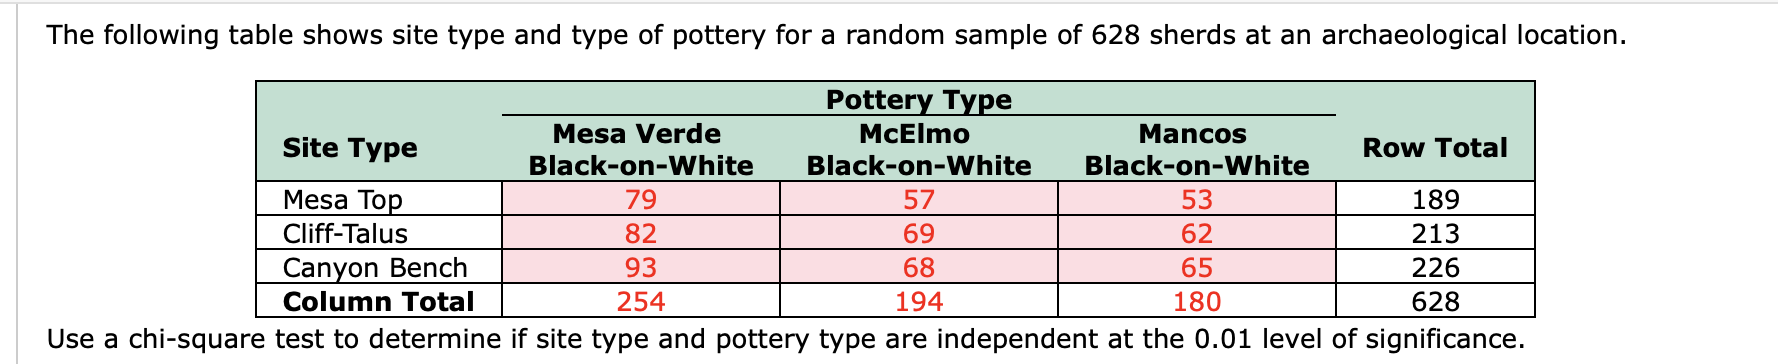

Transcribed Image Text:The following table shows site type and type of pottery for a random sample of 628 sherds at an archaeological location.
Pottery Type
Site Type
Mesa Verde
McElmo
Mancos
Row Total
Black-on-White
Black-on-White
Black-on-White
Mesa Top
79
57
53
189
Cliff-Talus
Canyon Bench
82
69
62
213
93
68
65
226
Column Total
254
194
180
628
Use a chi-square test to determine if site type and pottery type are independent at the 0.01 level of significance.
Expert Solution
This question has been solved!
Explore an expertly crafted, step-by-step solution for a thorough understanding of key concepts.

This is a popular solution

Trending nowThis is a popular solution!

Step by stepSolved in 4 steps with 1 images

Knowledge Booster


Learn more about
Need a deep-dive on the concept behind this application? Look no further. Learn more about this topic, statistics and related others by exploring similar questions and additional content below.Similar questions
- Just answer: According to the P value, what is the mean difference statistically significant? Based on the results, can you reject the null hypothesis? Is the entire staff operating at a good level?arrow_forwardYou intend to conduct a goodness-of-fit test for a multinomial distribution with 5 categories. You collect data from 71 subjects. What are the degrees of freedom for the x² distribution for this test? d.f. = 85arrow_forwardStress at work: In a poll about work, 51% of respondents said that their jobs were sometimes or always stressful. Eleven workers are chosen at random.What is the mean number who find their jobs stressful in a sample of 11 workers? Round the answer to two decimal places.arrow_forward
- You intend to conduct a goodness-of-fit test for a multinomial distribution with 3 categories. You collect data from 77 subjects. What are the degrees of freedom for the x? distribution for this test? d.f. =arrow_forwardestion Help In a psychology journal, researchers reported that a chief executive officer's facial structure can be used to predict a firm's financial performance. The study involved measuring the facial width-to-height ratio (WHR) for each in a sample of 51 CEOS at publicly traded Fortune 500 firms. These WHR values (determined by computer analyzing a photo of the CEO's face) had a mean of x = 1.81 and a standard deviation of s = 0.12. Use this information to complete parts a and b below. a. Find and interpret a 90% confidence interval for u, the mean facial WHR for all CEOS at publicly traded Fortune 500 firms. (Round to three decimal places as needed.) O A. The 90% confidence interval for mean facial WHR indicates that the true mean facial WHR for the CEOS in the sample is between and with 90% confidence. O B. The 90% confidence interval for mean facial WHR indicates that 90% of all CEOS at publicly traded Fortune 500 firms have a WHR between and O C. The 90% confidence interval for…arrow_forwardStress at work: In a poll about work, 41% of respondents said that their jobs were sometimes or always stressful. Thirteen workers are chosen at random. Part 1 of 2 (a) What is the mean number who find their jobs stressful in a sample of 13 workers? Round the answer to two decimal places. The mean number who find their jobs stressful is Part 2 of 2 (b) What is the standard deviation of the number who find their jobs stressful in a sample of 13 workers? Round the answer to four decimal places. The standard deviation of the number who find their jobs stressful isarrow_forward
- You intend to conduct a goodness-of-fit test for a multinomial distribution with 3 categories. You collect data from 78 subjects. What are the degrees of freedom for the x? distribution for this test? d.f. =arrow_forwardWe would like to investigate if there is a difference in mean coffee consumption frequency between students at Rutgers, Princeton, and the University of Michigan. What test would we likely conduct? Independent samples t-test One Sample z-test Paired samples t-test One Way ANOVAarrow_forwardYou want to compare differences in prior arrests across ethnicity in your study, you measured ethnicity as white =0 black =1 hispanic=2, and other =3. Prior arrests was recorded as the number of prior arrests. which test would you perform to see if arrests differ across diffrent ethnic categories? A. ANOVA B. T-testarrow_forward
- Consider the following data: −10, −10, 0, 3, −10, 3, 3 Step 1 of 3: Calculate the value of the sample Variance. Round your answer to one decimal place. Step 2 of 3: Calculate the value of the sample deviation. Round your answer to one decimal place. Step 3 of 3: Calculate the value of the range.arrow_forwardComplete the table. Observed Expected Frequency Frequency Residual Squared Category A 25 21 36 20 What is the chi-square test-statistic for this data? Barrow_forward1.Statistical Literacy Consider the mode, median, and mean. Which average represents the middle value of a data distribution? Which average represents the most frequent value of a distribution? Which average takes all the specific valuesinto account?arrow_forward
arrow_back_ios
arrow_forward_ios
Recommended textbooks for you
- MATLAB: An Introduction with ApplicationsStatisticsISBN:9781119256830Author:Amos GilatPublisher:John Wiley & Sons Inc
 Probability and Statistics for Engineering and th...StatisticsISBN:9781305251809Author:Jay L. DevorePublisher:Cengage Learning
 Statistics for The Behavioral Sciences (MindTap C...StatisticsISBN:9781305504912Author:Frederick J Gravetter, Larry B. WallnauPublisher:Cengage Learning
  Elementary Statistics: Picturing the World (7th E...StatisticsISBN:9780134683416Author:Ron Larson, Betsy FarberPublisher:PEARSON
 The Basic Practice of StatisticsStatisticsISBN:9781319042578Author:David S. Moore, William I. Notz, Michael A. FlignerPublisher:W. H. Freeman
 Introduction to the Practice of StatisticsStatisticsISBN:9781319013387Author:David S. Moore, George P. McCabe, Bruce A. CraigPublisher:W. H. Freeman
MATLAB: An Introduction with Applications
Statistics
ISBN:9781119256830
Author:Amos Gilat
Publisher:John Wiley & Sons Inc
Probability and Statistics for Engineering and th...
Statistics
ISBN:9781305251809
Author:Jay L. Devore
Publisher:Cengage Learning
Statistics for The Behavioral Sciences (MindTap C...
Statistics
ISBN:9781305504912
Author:Frederick J Gravetter, Larry B. Wallnau
Publisher:Cengage Learning
Elementary Statistics: Picturing the World (7th E...
Statistics
ISBN:9780134683416
Author:Ron Larson, Betsy Farber
Publisher:PEARSON
The Basic Practice of Statistics
Statistics
ISBN:9781319042578
Author:David S. Moore, William I. Notz, Michael A. Fligner
Publisher:W. H. Freeman
Introduction to the Practice of Statistics
Statistics
ISBN:9781319013387
Author:David S. Moore, George P. McCabe, Bruce A. Craig
Publisher:W. H. Freeman