ENGR.ECONOMIC ANALYSIS
14th Edition
ISBN: 9780190931919
Author: NEWNAN
Publisher: Oxford University Press
expand_more
expand_more
format_list_bulleted
Question

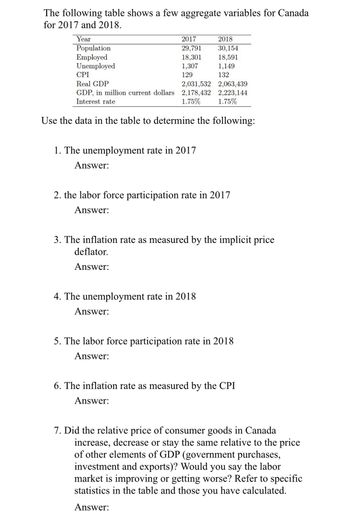
Transcribed Image Text:The following table shows a few aggregate variables for Canada
for 2017 and 2018.
Year
Population
Employed
Unemployed
2017
29,791
18,301
1,307
129
CPI
Real GDP
2,031,532
2,063,439
GDP, in million current dollars 2,178,432 2,223,144
Interest rate
1.75%
1.75%
Use the data in the table to determine the following:
1. The unemployment rate in 2017
Answer:
2018
30,154
18,591
1,149
132
2. the labor force participation rate in 2017
Answer:
3. The inflation rate as measured by the implicit price
deflator.
Answer:
4. The unemployment rate in 2018
Answer:
5. The labor force participation rate in 2018
Answer:
6. The inflation rate as measured by the CPI
Answer:
7. Did the relative price of consumer goods in Canada
increase, decrease or stay the same relative to the price
of other elements of GDP (government purchases,
investment and exports)? Would you say the labor
market is improving or getting worse? Refer to specific
statistics in the table and those you have calculated.
Answer:
Expert Solution
This question has been solved!
Explore an expertly crafted, step-by-step solution for a thorough understanding of key concepts.
Step by stepSolved in 4 steps

Knowledge Booster
Learn more about
Need a deep-dive on the concept behind this application? Look no further. Learn more about this topic, economics and related others by exploring similar questions and additional content below.Similar questions
- Section 3: Inflation and Unemployment The labour market Fill in the missing data in the table illustrating some labor market data for New-England Explain how the missing data was received. Data Type Working age population (x 1 000) Inactive population (x 1000) Active population (x 1 000) Employed (x 1 000) Unemployed (x 1 000) Unemployment rate (%) Activity rate (%) Employment rate (%) T1 2013 28476.9 66.6 61.8 T2 2013 28566.1 7.1 66.5 T3 2013 28667.9 9616.8 19051.1 17698.8 1352.3 7.1 66.5 61.7 T4 2013 28757.7 9681.9 19075.8 17735.3 1340.6 7 66.3 61.7 T1 2014 9737 17748.3 61.5 T2 2014 28912 9812.2 19099.8 17762 1337.7 7 66.1 61.4 T3 2014 29001.8 9868.1 19133.7 17791.7 1342 7 66 61.3 T4 2014 29073.7 1290.9 6.7 T1 2015 29138.7 9983 19155.7 17873.1 1282.5 6.7 65.7…arrow_forwardQuestion 3 The table below gives some labor statistics (from the Bureau of Labor Statistics) for years 1995, 2000 and 2005. Use these data to answer the following questions. Express your answers in percentage terms to two places past the decimal. Variable 1995 2000 2005 Population 26,000,000 27,000,000 28,000,000 Adult population 18,000,000 19,000,000 20,500,000 Adult population able to work 17,900,000 18,800,000 20,000,000 Adult population able and wanting to work 15,700,000 16,500,000 18,000,000 Number employed 14,000,000 14,500,000 15,000,000 Number unemployed 1,000,000 1,500,000 2,500,000 a. Define labor force. For each year find the labor force b. Define the labor-force participation rate. Calculate it for each year c. Calculate the unemployment rate for each year.arrow_forwardHousehold Employment Data (Numbers in billions) Working age Population Labor Force Employed Unemployed October 2019 259.8 164.4 158.5 5.8 July 2020 260.4 159.9 143.5 17.8 October 2020 260.9 160.9 149.8 11.1 Source: https://www.bls.gov/news.release/empsit.t01.htm Let’s calculate labor force participation and the unemployment rate for October 2019. X 100 Labor Force Participation Rate = People in the Labor Force Total Working Age Population X 100 = 164.4 259.8 = 0.6327 X 100 = 63.3% X 100 Unemployment Rate = Unemployed People X 100 Total Labor Force = 5.8 164.4 = 0.0353 X…arrow_forward
- The following table contains unemployment statistics from 2013 for three different countries: Australia, the Netherlands, and France. (Source: “International Labor Comparisons.”Bureau of Labor Statistics) Fill in the table using the given data. Country Working-Age (Civilian Not in Civilian Employed Unemployed Unemployment Non-institutionalized) the Labor Force Labor Force (Thousands) (Thousands) Rate Population (Thousands) (Thousands) (Percent) (Thousands) Australia 18,332 6,196 12,136 11,501 635 Netherlands 13,629 4,796 8,364 469 France 22,411 25,547 2,824arrow_forwardThe table below presents actual household data collected by the BLS for September 2018 and September 2019 ( It is attached) Please show me how you got the answer. Use the information in the table above to compute the numerical values for the following categories, for Sept. 18 and Sept. 19 ( Make sure to also Provide the equation or formula you used to calculate each category) Sept. 2019 Sept. 2020 Population Labor force Participation rate Employment-population ratio Unemployment ratearrow_forward
arrow_back_ios
arrow_forward_ios
Recommended textbooks for you

 Principles of Economics (12th Edition)EconomicsISBN:9780134078779Author:Karl E. Case, Ray C. Fair, Sharon E. OsterPublisher:PEARSON
 Engineering Economy (17th Edition)EconomicsISBN:9780134870069Author:William G. Sullivan, Elin M. Wicks, C. Patrick KoellingPublisher:PEARSON
 Principles of Economics (MindTap Course List)EconomicsISBN:9781305585126Author:N. Gregory MankiwPublisher:Cengage Learning
 Managerial Economics: A Problem Solving ApproachEconomicsISBN:9781337106665Author:Luke M. Froeb, Brian T. McCann, Michael R. Ward, Mike ShorPublisher:Cengage Learning
 Managerial Economics & Business Strategy (Mcgraw-...EconomicsISBN:9781259290619Author:Michael Baye, Jeff PrincePublisher:McGraw-Hill Education


Principles of Economics (12th Edition)
Economics
ISBN:9780134078779
Author:Karl E. Case, Ray C. Fair, Sharon E. Oster
Publisher:PEARSON

Engineering Economy (17th Edition)
Economics
ISBN:9780134870069
Author:William G. Sullivan, Elin M. Wicks, C. Patrick Koelling
Publisher:PEARSON

Principles of Economics (MindTap Course List)
Economics
ISBN:9781305585126
Author:N. Gregory Mankiw
Publisher:Cengage Learning

Managerial Economics: A Problem Solving Approach
Economics
ISBN:9781337106665
Author:Luke M. Froeb, Brian T. McCann, Michael R. Ward, Mike Shor
Publisher:Cengage Learning

Managerial Economics & Business Strategy (Mcgraw-...
Economics
ISBN:9781259290619
Author:Michael Baye, Jeff Prince
Publisher:McGraw-Hill Education