ENGR.ECONOMIC ANALYSIS
14th Edition
ISBN: 9780190931919
Author: NEWNAN
Publisher: Oxford University Press
expand_more
expand_more
format_list_bulleted
Question
None

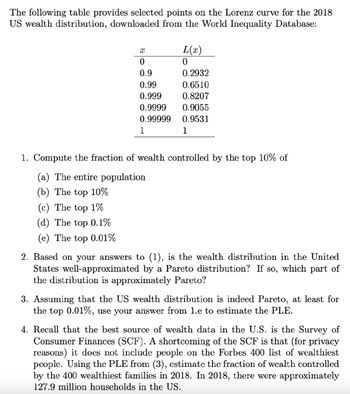
Transcribed Image Text:The following table provides selected points on the Lorenz curve for the 2018
US wealth distribution, downloaded from the World Inequality Database:
X
L(x)
0
0.9
0.2932
0.99
0.6510
0.999
0.8207
0.9999
0.9055
0.99999
0.9531
1
1
1. Compute the fraction of wealth controlled by the top 10% of
(a) The entire population
(b) The top 10%
(c) The top 1%
(d) The top 0.1%
(e) The top 0.01%
2. Based on your answers to (1), is the wealth distribution in the United
States well-approximated by a Pareto distribution? If so, which part of
the distribution is approximately Pareto?
3. Assuming that the US wealth distribution is indeed Pareto, at least for
the top 0.01%, use your answer from 1.e to estimate the PLE.
4. Recall that the best source of wealth data in the U.S. is the Survey of
Consumer Finances (SCF). A shortcoming of the SCF is that (for privacy
reasons) it does not include people on the Forbes 400 list of wealthiest
people. Using the PLE from (3), estimate the fraction of wealth controlled
by the 400 wealthiest families in 2018. In 2018, there were approximately
127.9 million households in the US.
Expert Solution
This question has been solved!
Explore an expertly crafted, step-by-step solution for a thorough understanding of key concepts.
Step by stepSolved in 2 steps

Knowledge Booster
Similar questions
Recommended textbooks for you

 Principles of Economics (12th Edition)EconomicsISBN:9780134078779Author:Karl E. Case, Ray C. Fair, Sharon E. OsterPublisher:PEARSON
 Engineering Economy (17th Edition)EconomicsISBN:9780134870069Author:William G. Sullivan, Elin M. Wicks, C. Patrick KoellingPublisher:PEARSON
 Principles of Economics (MindTap Course List)EconomicsISBN:9781305585126Author:N. Gregory MankiwPublisher:Cengage Learning
 Managerial Economics: A Problem Solving ApproachEconomicsISBN:9781337106665Author:Luke M. Froeb, Brian T. McCann, Michael R. Ward, Mike ShorPublisher:Cengage Learning
 Managerial Economics & Business Strategy (Mcgraw-...EconomicsISBN:9781259290619Author:Michael Baye, Jeff PrincePublisher:McGraw-Hill Education


Principles of Economics (12th Edition)
Economics
ISBN:9780134078779
Author:Karl E. Case, Ray C. Fair, Sharon E. Oster
Publisher:PEARSON

Engineering Economy (17th Edition)
Economics
ISBN:9780134870069
Author:William G. Sullivan, Elin M. Wicks, C. Patrick Koelling
Publisher:PEARSON

Principles of Economics (MindTap Course List)
Economics
ISBN:9781305585126
Author:N. Gregory Mankiw
Publisher:Cengage Learning

Managerial Economics: A Problem Solving Approach
Economics
ISBN:9781337106665
Author:Luke M. Froeb, Brian T. McCann, Michael R. Ward, Mike Shor
Publisher:Cengage Learning

Managerial Economics & Business Strategy (Mcgraw-...
Economics
ISBN:9781259290619
Author:Michael Baye, Jeff Prince
Publisher:McGraw-Hill Education