
A First Course in Probability (10th Edition)
10th Edition
ISBN: 9780134753119
Author: Sheldon Ross
Publisher: PEARSON
expand_more
expand_more
format_list_bulleted
Related questions
Question
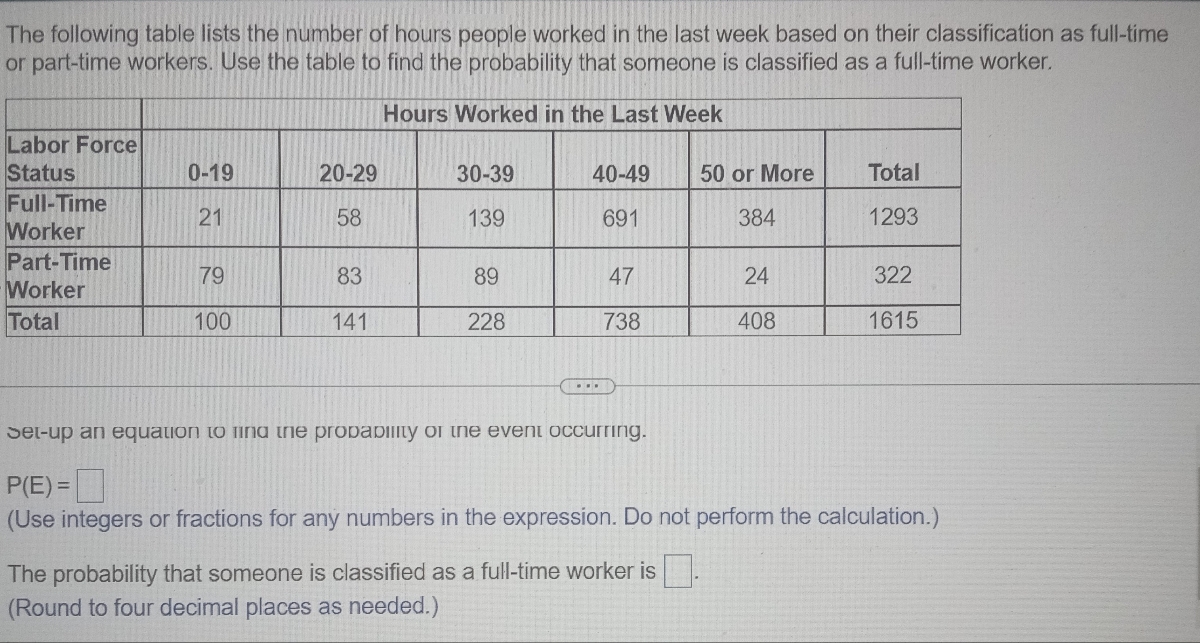

Transcribed Image Text:The following table lists the number of hours people worked in the last week based on their classification as full-time
or part-time workers. Use the table to find the probability that someone is classified as a full-time worker.
Hours Worked in the Last Week
Labor Force
Status
Full-Time
Worker
Part-Time
Worker
Total
0-19
21
79
100
20-29
58
83
141
30-39
139
89
228
40-49
691
...
47
738
50 or More
384
The probability that someone is classified as a full-time worker is
(Round to four decimal places as needed.)
24
408
Total
1293
322
1615
set-up an equation to find the probability of the event occurring.
P(E)=
(Use integers or fractions for any numbers in the expression. Do not perform the calculation.)
Expert Solution
This question has been solved!
Explore an expertly crafted, step-by-step solution for a thorough understanding of key concepts.

This is a popular solution

Trending nowThis is a popular solution!

Step by stepSolved in 3 steps with 3 images

Knowledge Booster

Similar questions
- A recent survey by a market research company found that 56% of all US households have internet access. Answer the following as decimals rounded to three places. a. If five households are chosen at random, what is the probability that all five have internet access? Preview b. What is the probability that none of the five have internet access? Preview c. If five households are chosen, what is the probability that at least one household has internet access? Previewarrow_forwardUse the data in the table below, which shows the employment status of individuals in a particular town by age group. Age Full-time Part-time Unemployed 0—17 27 180 360 18—25 190 198 233 26—34 317 71 26 35—49 462 183 192 50+ 356 165 258 If a person is randomly chosen from the town's population, what is the probability that the person is under 18 or employed part-time?arrow_forwardThe following table shows the distribution of murders by type of weapon for murder cases in a particular country over the past 12 years. Complete parts (a) through (e). (b) What is the probability that a randomly selected murder resulted from a rifle or shotgun? (Type a decimal rounded to three decimal places as needed.) P(rifle or shotgun) = Interpret this probability. Select the correct choice below and fill in the answer box to complete your choice. OA. If 1000 murders were randomly selected, exactly of them would have resulted from a rifle or shotgun. B. If 1000 murders were randomly selected, we would expect about of the to have resulted from a rifle or shoto (c) What is the probability that a randomly selected murder resulted from a handgun, rifle, or shotgun? P(handgun, rifle, or shotgun) = (Type a decimal rounded to three decimal places as needed.) Interpret this probability. Select the correct choice below and fill in the answer box to complete your choice. OA. If 1000 murders…arrow_forward
- The following table represents the highest educational attainment of all adult residents in a certain town. If a resident who is 40 or older is chosen at random, what is the probability that they have only completed high school? Round your answer to the nearest thousandth. Age 20-29 Age 30-39 | Age 40-49 | Age 50 & over Total High school only 1634 1411 917 936 4898 Some college 1946 1303 785 1176 5210 Bachelor's degree 1295 1536 777 1980 5588 Master's degree 818 949 195 792 2754 Total 5693 5199 2674 4884 18450arrow_forwardThe following table lists the number of unicyclists in Corvallis, OR. by age group. Age Group Frequency <19 20-29 45 30-39 22 40-49 13 50-59 79 60-69 270 46 What is the probability that a randomly selected unicyclist from Corvallis, OR. is not younger than 20? Answer in decimal form. Round your answer to 3 decimal places.arrow_forwardThe following table represents the highest educational attainment of all adult residents in a certain town. If a resident who has a master's degree is chosen at random, what is the probability that they are aged 30-39? Round your answer to the nearest thousandth. High school only Some college Bachelor's degree Master's degree Total Age 20- 29 Age Age 30- 40- 39 49 642 666 879 Age 50 & over 1511 1352 1458 1091 461 688 580 4194 3699 3273 1338 3525 Total 1580 993 356 1281 4210 1068 5412 2797 4778 15944arrow_forward
- A new boarding policy has been proposed by an airline. Frequent flyers and non-frequent flyers were asked for their opinions, and the results are summarized in the table shown here. Find the probability a person chosen at random from among the people surveyed favors the new policy and is a frequent flyer. Enter your answer correctly to two decimal places. Remember, a probability is expressed as a number between zero and one, inclusive. Opinion on Policy In Favor Of (A) Neutral (B) Opposed To (C) Frequent Fliers (D) 48% 23% 4% 75% Non-Frequent Fliers (E) 15% 3% 7% 25% 63% 26% 11% 100%arrow_forwardThe following table represents the highest educational attainment of all adult residents in a certain town. If a resident who is aged 20-29 is chosen at random, what is the probability that they have completed a master's degree? Round your answer to the nearest thousandth. High school only Some college Bachelor's degree Master's degree Total Answer: Age 20-29 Age 30-39 Age 40-49 Age 50 & over 1830 707 885 1031 773 3396 992 1474 1511 344 4321 570 1584 1375 578 4107 Submit Answer 1075 1016 1314 5235 Total 4099 5018 4933 3009 17059 Te STORE 18arrow_forwardThe following table summarizes the ages of the 400 richest Americans. Suppose we select one of these individuals. Find the probability that the selected individual is less than 80 years old. Ages Frequency less than 40 7 40 up to 50 47 50 up to 60 90 60 up to 70 109 70 up to 80 93 80 up to 90 45 90 or more 9arrow_forward
- K The following data represent the number of drivers involved in a fatal crash in 2016 in various light and weather conditions. Complete parts (a) through (c) below. Click the icon to view the data for fatal crashes in 2016. (a) Among fatal crashes in unknown weather conditions, what is the probability that a randomly selected fatal crash occurs when it is dawn/dusk? The probability that a randomly selected fatal crash in unknown weather conditions occurs when it is dawn/dusk is approximately. (Round to three decimal places as needed.) Data table Weather Daylight Dark, but Lighted 5875 497 51 54 255 Normal Rain Snow/Sleet Other Unknown 14,307 875 219 125 810 (...) Dark 8151 681 156 220 548 Dawn/Dusk Other 1183 87 40 71 65 8 2 9 133 Xarrow_forwardThe following table represents the highest educational attainment of all adult residents in a certain town. If an adult is chosen randomly from the town, what is the probability that they have a high school degree or some college, but have no college degree? Round your answer to the nearest thousandth. Age 20-29 Age 30-39 | Age 40-49 | Age 50 & over Total High school only 1360 1326 397 859 3942 Some college 1536 1140 1092 2724 6492 Bachelor's degree 978 1387 958 1002 4325 Master's degree 464 1001 351 195 2011 Total 4875 4204 2642 5049 16770arrow_forwardData from a survey can allow one to estimate how many people who classified their work status as part-time or full-time actually worked in the last week. Find the probability that the hours worked were 29 or less given that the worker was part-time. Labor Force Status Full-Time Worker Part-Time Worker Total 0-19 20-29 30-39 40-49 25 Hours Worked in the Last Week 50 or More 74 99 45 134 693 378 1275 Total 81 83 42 23 303 126 217 735 401 1578 The probability that the hours worked were 29 or less and that the worker was part-time is (Round to four decimal places as needed.) The probability that the hours worked were 29 or less given that the worker was part-time is (Round to four decimal places as needed.)arrow_forward
arrow_back_ios
arrow_forward_ios
Recommended textbooks for you
- A First Course in Probability (10th Edition)ProbabilityISBN:9780134753119Author:Sheldon RossPublisher:PEARSON

A First Course in Probability (10th Edition)
Probability
ISBN:9780134753119
Author:Sheldon Ross
Publisher:PEARSON