
MATLAB: An Introduction with Applications
6th Edition
ISBN: 9781119256830
Author: Amos Gilat
Publisher: John Wiley & Sons Inc
expand_more
expand_more
format_list_bulleted
Related questions
Question
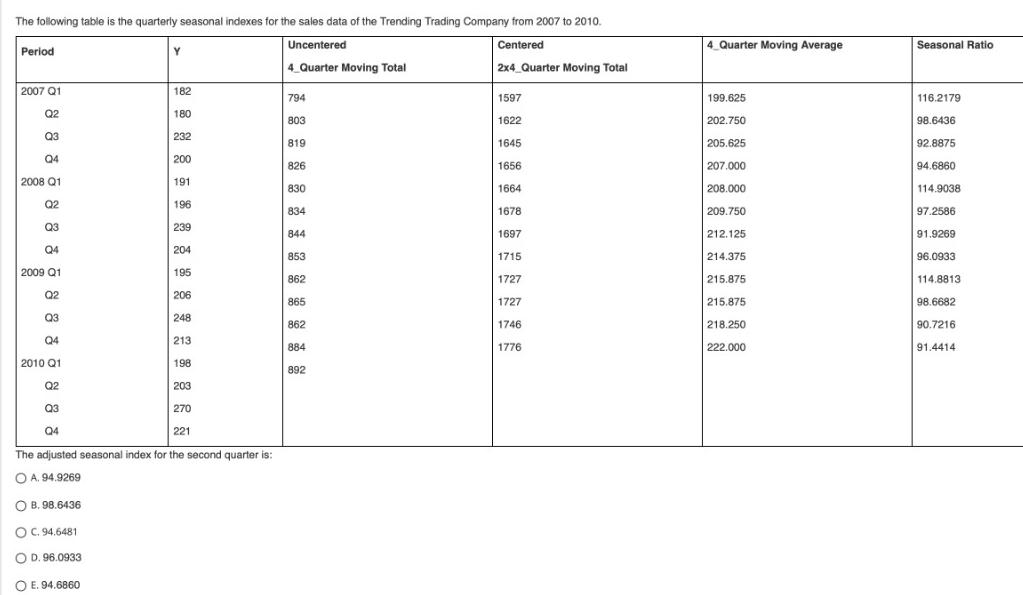

Transcribed Image Text:The following table is the quarterly seasonal indexes for the sales data of the Trending Trading Company from 2007 to 2010.
Uncentered
Centered
4 Quarter Moving Total
2x4 Quarter Moving Total
Period
2007 Q1
Q2
Q3
Q4
2008 Q1
Q2
Q3
Q4
2009 Q1
Q2
Q3
Q4
2010 Q1
Q2
2 88
Q3
Q4
Y
OE. 94.6860
182
180
232
200
191
196
239
204
195
206
248
213
198
270
221
The adjusted seasonal index for the second quarter is:
OA. 94.9269
OB. 98.6436
OC. 94.6481
D. 96.0933
203
794
803
819
826
830
834
844
853
862
865
862
884
892
1597
1622
1645
1656
1664
1678
1697
1715
1727
1727
1746
1776
4 Quarter Moving Average
199.625
202.750
205.625
207.000
208.000
209.750
212.125
214.375
215.875
215.875
218.250
222.000
Seasonal Ratio
116.2179
98.6436
92.8875
94.6860
114.9038
97.2586
91.9269
96.0933
114.8813
98.6682
90.7216
91.4414

Transcribed Image Text:In an ever-changing economy, the price of fuel is never constant for too long. The following table shows the average prices and quantities sold of petrol and diesel for June 2012 and June 2014 in the Western Cape.
Jun-12
Jun-14
Quantity sold Price Quantity sold
(millions of litres) (Rand) (millions of litres)
1698
9.83
1744
1406
10.80
1489
Fuel
Petrol
Diesel
If the base year is 2012, find the Laspeyres Price Index. Round off to four decimals.
O A. 95.9410
B. 104.0966
Price
(Rands)
8.27
7.67
O C. 77.7839
O D. 77.8842
Expert Solution
arrow_forward
Step 1
Solution:
According to the guidelines first question should be answered when there are multiple questions asked. In case the remaining questions are needed please repost them as separately.

Step by stepSolved in 2 steps with 3 images

Knowledge Booster

Similar questions
- What is the relationship between the geometric average rate of return and compound interest?arrow_forwardThe following problem refers to the stock table for ABC Inc. (a tire company) given below. Use the stock table to answer the following questions. Where necessary, round the dollar amounts to the nearest cent. 52-Week Yld Vol Net High Low Stock SYM Div % PE 100s Hi Lo Close Chg 80.69 45.87 ABC Inc. ABC 2.99 1.5 17 5915 58.50 57.51 58.12 +1.41 ..... a. What were the high and low prices for a share for the past 52 weeks? High price: $ Low price: $arrow_forwardIf my bus is 3.5 years old, what are the projected annual maintenance costs? (Enter a whole number) Age of Bus(years)Annual Maintenance Cost($)2.4 3502.3 3702.4 4803.1 5203 5905.8 5504.8 7503.8 8003.6 7904.9 9505.5 915arrow_forward
- For the following cash flow, use the interpolation technique to compute the interest rate at which the $240 cost is equivalent to the subsequent benefits. Year 0 1 Cash Flow -240 75 2 95 3 100 4 85arrow_forwardThe accompanying data represent the annual rates of return of two companies' stock for the past 12 years. Complete parts (a) through (k). O A. OB. 0.50- 0.50- 0.00- 0.00- -0.50- -0.50- -0.3 RR of Company 2 0.0 0.3 -0.3 0.0 0.3 RR of Company 1 OC. 0.30- 0.50- 0.00- 0.00- -0.30- -0.50- o.0 0'5 0.0 0.3 -0.5 RR of Company 2 0.5 -0.3 RR of Company 1 (b) Determine the correlation coefficient between rate of return of Company 1 and Company 2. The correlation coefficient is 0.966. (Round to three decimal places as needed.) (c) Based on the scatter diagram and correlation coefficient, is there a linear relation between rate of return of Company 1 and Company 2? Yes No (d) Find the least-squares regression line treating the rate of return of Company 1 as the explanatory variable. y=x+O (Round to four decimal places as needed.) RR of Company 1 RR of Company 1 RR of Company 2 RR of Company 2arrow_forwardPlease Answer 3 Sub Parts the question and no Reject.... Thank uarrow_forward
- Monthly Sales 6267.19 7058.06 7119.5 7147.18 7198.52 7298.09 7325.7 7335.68 7355.97 7481.05 7490.23 7530.08 7616.09 7682.69 7684.14 7704.12 7704.98 7779.28 7798.23 7815.15 7844.16 7890.21 7977.6 7993.16 8021.03 8028.37 8068.86 8082.42 8096.17 8119.25 8129.21 8190.68 8255.28 8282.44 8376.31 8392.4 8400.95 8451.16 8456.66 8505.35 8539.25 8543.65 8573.05 8641.78 8667.48 8751.08 8777.97 8800.08 8888.65 8907.03 9096.87 9241.74 9411.68 9450.73 9484.62 9514.57 9521.4 9524.91 9733.44 10123.24 Given the company’s performance record and based on the empirical rule of normal distribution (also known as the 68%-95%-99.7% rule), what would be the lower bound of the range of sales values that contains 68% of the monthly sales? What would be the upper bound of the range of sales values that contains 68% of the monthly sales?arrow_forwardNjarrow_forwardVirginia Community College Syst X N Quiz: Quiz 2 - Unit 3 s/355859/quizzes/2912611/take Year CPI 2009 214.5 2010 218.1 2011 224.9 2012 229.6 2013 233.0 2014 236.7 2015 237.0 2016 240.0 Calculate the rate of inflation from 2011 to 2016. (round to the nearest tenth of a percent)arrow_forward
- The following investment requires a table factor for a period beyond the table. Calculate the new table factor and the present value (principal). Use Table 11-2. Round your new table factor to five decimal places and your present value to the nearest cent. CompoundAmount Term ofInvestment (years) NominalRate (%) InterestCompounded New TableFactor PresentValue $36,000 36 7 annually $arrow_forwardThe following data were taken from Miller Company's balance sheet: Dec. 31, Year 2 Dec. 31, Year 1 Total liabilities $150,000 $105,000 Total stockholders' equity 75,000 60,000 a. Compute the ratio of liabilities to stockholders' equity. Round your answers to one decimal place. Liabilities toStockholders' Equity 12/31/Year 2: fill in the blank 1 12/31/Year 1: fill in the blank 2 b. Has the creditors' risk increased or decreased from December 31, Year 1, to December 31, Year 2?arrow_forwardSuppose that a firm's sales were $3,750,000 five years ago and are $5,250,000 today. What was the geometric mean growth rate in sales over the past five years?arrow_forward
arrow_back_ios
SEE MORE QUESTIONS
arrow_forward_ios
Recommended textbooks for you
- MATLAB: An Introduction with ApplicationsStatisticsISBN:9781119256830Author:Amos GilatPublisher:John Wiley & Sons Inc
 Probability and Statistics for Engineering and th...StatisticsISBN:9781305251809Author:Jay L. DevorePublisher:Cengage Learning
 Statistics for The Behavioral Sciences (MindTap C...StatisticsISBN:9781305504912Author:Frederick J Gravetter, Larry B. WallnauPublisher:Cengage Learning
  Elementary Statistics: Picturing the World (7th E...StatisticsISBN:9780134683416Author:Ron Larson, Betsy FarberPublisher:PEARSON
 The Basic Practice of StatisticsStatisticsISBN:9781319042578Author:David S. Moore, William I. Notz, Michael A. FlignerPublisher:W. H. Freeman
 Introduction to the Practice of StatisticsStatisticsISBN:9781319013387Author:David S. Moore, George P. McCabe, Bruce A. CraigPublisher:W. H. Freeman
MATLAB: An Introduction with Applications
Statistics
ISBN:9781119256830
Author:Amos Gilat
Publisher:John Wiley & Sons Inc
Probability and Statistics for Engineering and th...
Statistics
ISBN:9781305251809
Author:Jay L. Devore
Publisher:Cengage Learning
Statistics for The Behavioral Sciences (MindTap C...
Statistics
ISBN:9781305504912
Author:Frederick J Gravetter, Larry B. Wallnau
Publisher:Cengage Learning
Elementary Statistics: Picturing the World (7th E...
Statistics
ISBN:9780134683416
Author:Ron Larson, Betsy Farber
Publisher:PEARSON
The Basic Practice of Statistics
Statistics
ISBN:9781319042578
Author:David S. Moore, William I. Notz, Michael A. Fligner
Publisher:W. H. Freeman
Introduction to the Practice of Statistics
Statistics
ISBN:9781319013387
Author:David S. Moore, George P. McCabe, Bruce A. Craig
Publisher:W. H. Freeman