
MATLAB: An Introduction with Applications
6th Edition
ISBN: 9781119256830
Author: Amos Gilat
Publisher: John Wiley & Sons Inc
expand_more
expand_more
format_list_bulleted
Related questions
Concept explainers
Question
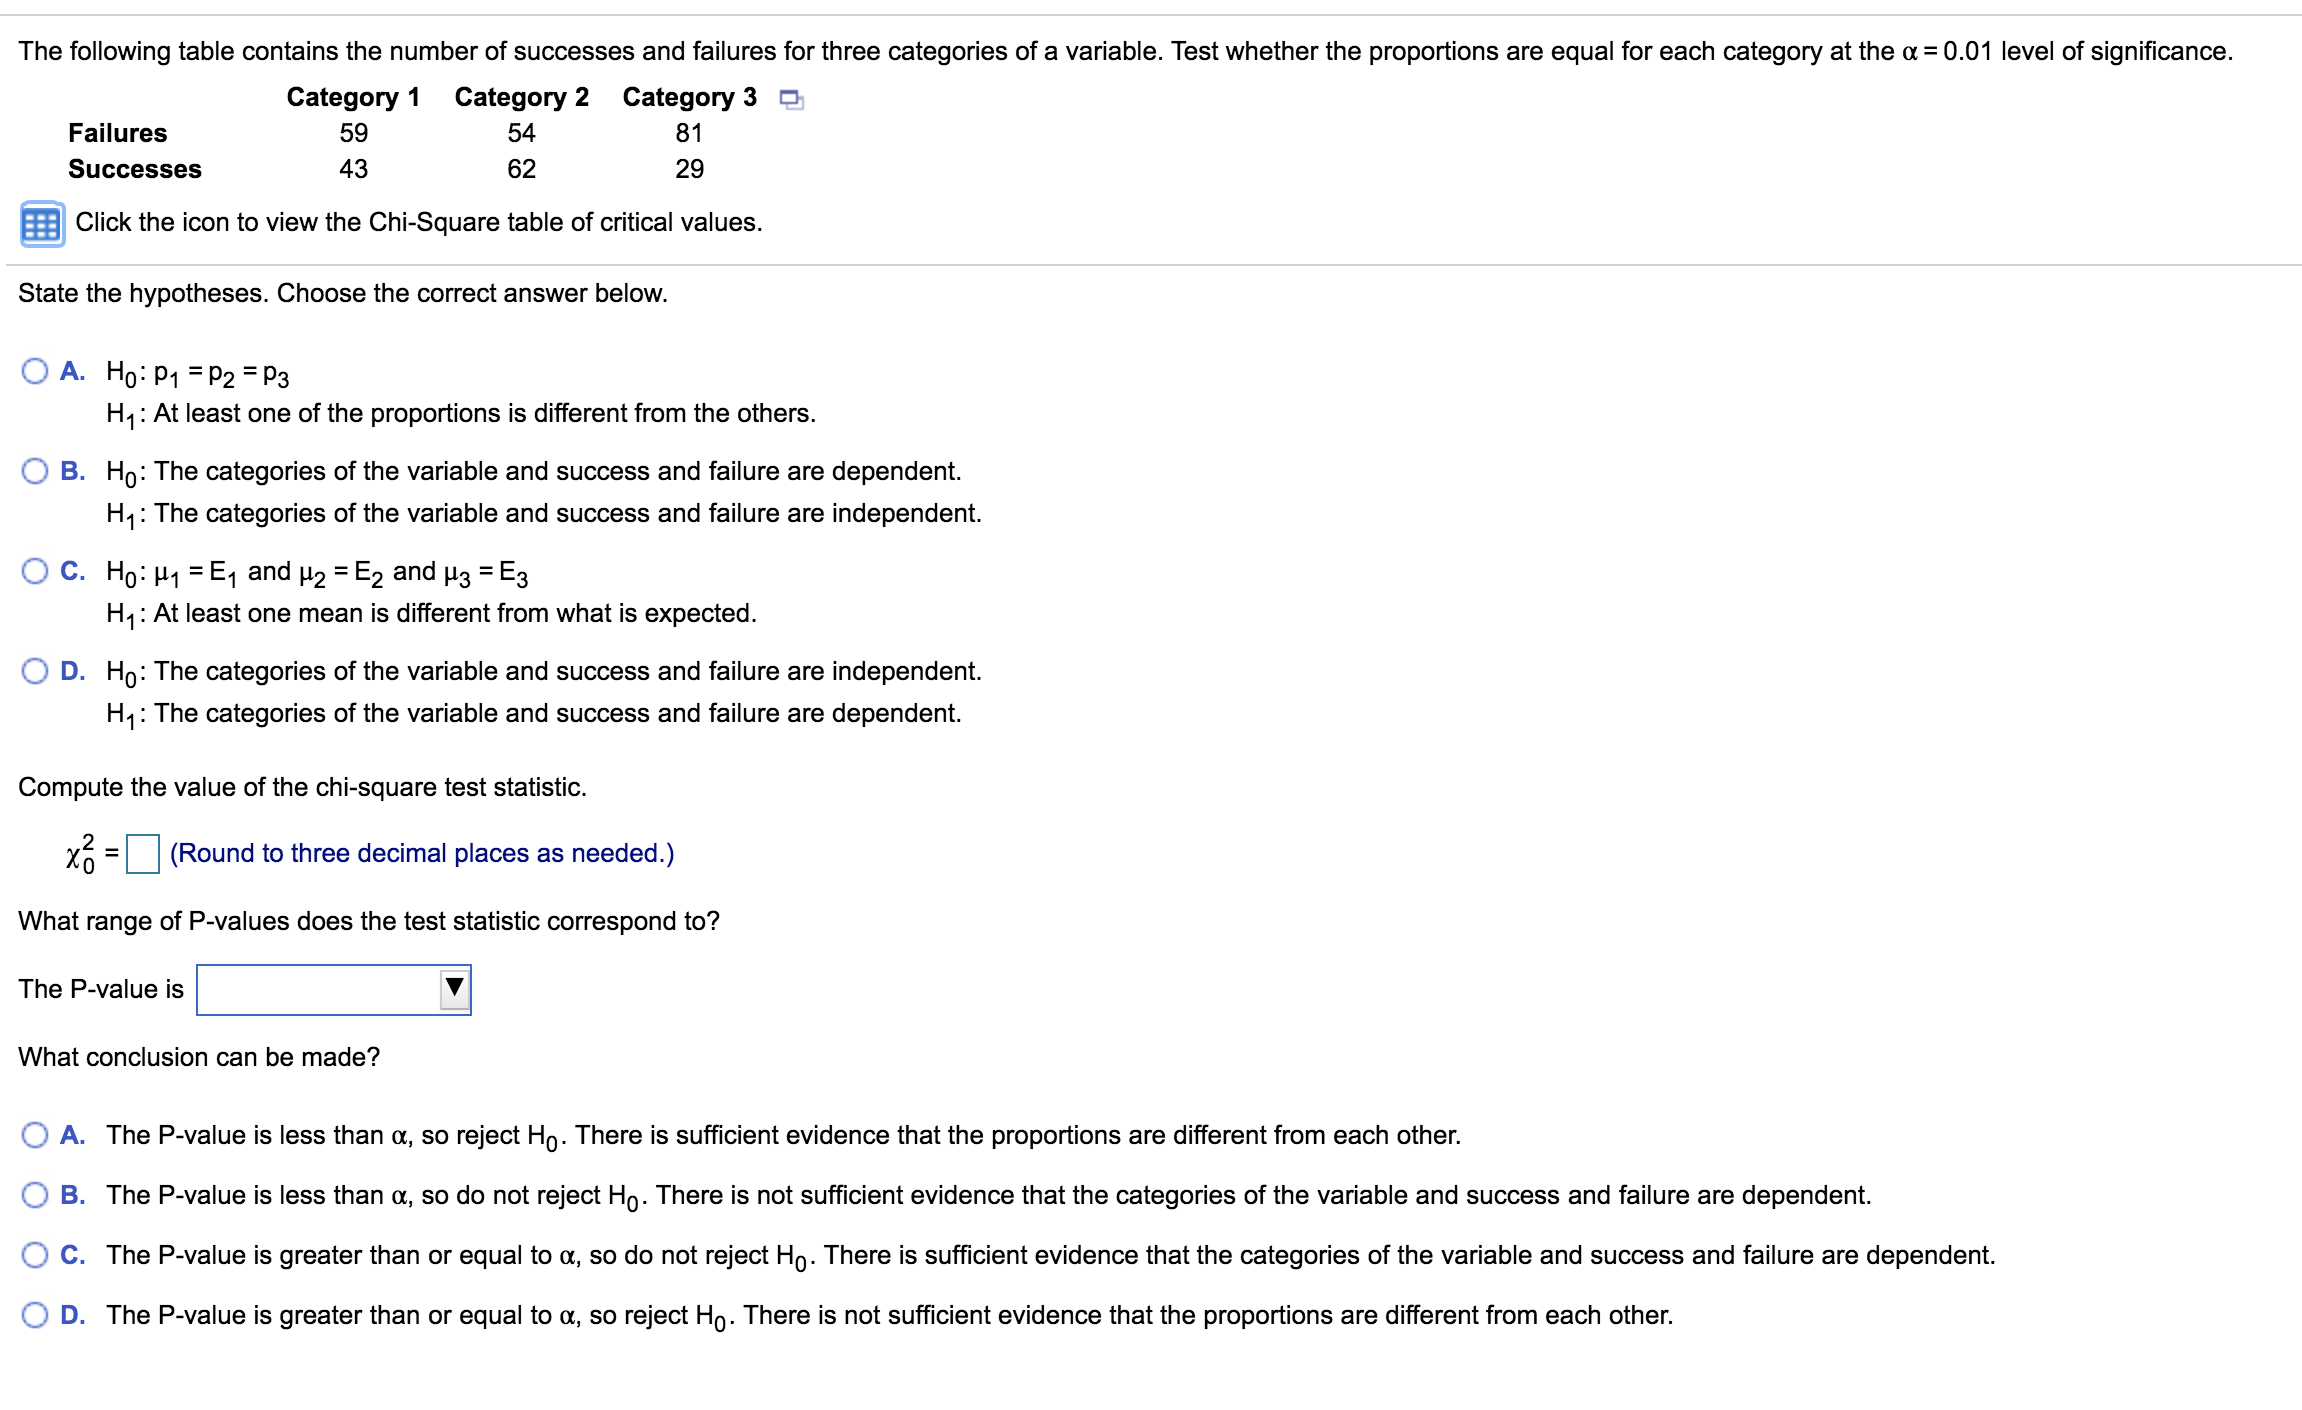

Transcribed Image Text:The following table contains the number of successes and failures for three categories of a variable. Test whether the proportions are equal for each category at the a = 0.01 level of significance.
Category 1
Category 2
Category 3 O
Failures
59
54
81
Successes
43
62
29
Click the icon to view the Chi-Square table of critical values.
State the hypotheses. Choose the correct answer below.
O A. Ho: P1 = P2 = P3
H,: At least one of the proportions is different from the others.
O B. Ho: The categories of the variable and success and failure are dependent.
H1: The categories of the variable and success and failure are independent.
O C. Ho: H1 = E, and µ2 = E2 and µ3 = E3
H1: At least one mean is different from what is expected.
%3D
%3D
O D. Ho: The categories of the variable and success and failure are independent.
H7:
: The categories of the variable and success and failure are dependent.
Compute the value of the chi-square test statistic.
(Round to three decimal places as needed.)
What range of P-values does the test statistic correspond to?
The P-value is
What conclusion can be made?
O A. The P-value is less than a, so reject Ho. There is sufficient evidence that the proportions are different from each other.
B. The P-value is less than a, so do not reject Ho. There is not sufficient evidence that the categories of the variable and success and failure are dependent.
O C. The P-value is greater than or equal to a, so do not reject Ho. There is sufficient evidence that the categories of the variable and success and failure are dependent.
O D. The P-value is greater than or equal to ɑ, so reject Ho. There is not sufficient evidence that the proportions are different from each other.
Expert Solution
This question has been solved!
Explore an expertly crafted, step-by-step solution for a thorough understanding of key concepts.

This is a popular solution

Trending nowThis is a popular solution!

Step by stepSolved in 3 steps with 5 images

Knowledge Booster


Learn more about
Need a deep-dive on the concept behind this application? Look no further. Learn more about this topic, statistics and related others by exploring similar questions and additional content below.Similar questions
- need help with Carrow_forwardUse the sample data and confidence level given below to complete parts (a) through (d). A research institute poll asked respondents if they felt vulnerable to identity theft. In the poll, n=931 and x=548 who said "yes." Use a 99% confidence level. LOADING... Click the icon to view a table of z scores. b) Identify the value of the margin of error E.arrow_forwardUrgent need help immediatelyarrow_forward
- I need p, q, & n Thankyou !arrow_forwardneed help pleasearrow_forwardThe average house has 15 paintings on its walls. Is the mean larger for houses owned by teachers? The data show the results of a survey of 16 teachers who were asked how many paintings they have in their houses. Assume that the distribution of the population is normal. 18, 15, 17, 14, 16, 17, 18, 15, 15, 14, 14, 14, 15, 15, 16, 18 What can be concluded at the a = 0.05 level of significance? a. For this study, we should use Select an answer b. The null and alternative hypotheses would be: Но: Select an answer v H1: Select an answer v c. The test statistic ? v = (please show your answer to 3 decimal places.) d. The p-value = (Please show your answer to 4 decimal places.) e. The p-value is ? va f. Based on this, we should Select an answer v the null hypothesis. g. Thus, the final conclusion is that ... O The data suggest the population mean is not significantly more than 15 at a = 0.05, so there is sufficient evidence to conclude that the population mean number of paintings that are in…arrow_forward
- You want to see if it makes a difference which lane to be in when there is traffic. You randomly observe 372 cars as they pass by on the four lane freeway. The results are displayed in the table below. Use a level of significance of a = 0.10. a. Complete the rest of the table by filling in the expected frequencies: Frequency of Cars in Each Lane Outcome Frequency Expected Frequency Lane 1 89 Lane 2 90 Lane 3 92 Lane 4 101arrow_forwardS Use the sample data and confidence level given below to complete parts (a) through (d). A research institute poll asked respondents if they felt vulnerable to identity theft. In the poll, n = 998 and x = 522 who said "yes." Use a 99% confide Click the icon to view a table of z scores. a) Find the best point estimate of the population proportion p. (Round to three decimal places as needed.) n example Get more help -arrow_forwardSeveral friends charted a boat for a day's fishing. They caught a total of 51 fish. The table below provides information about the type and number of fish caught. determine the empirical probablity that the next fish caught is a flounder. Grouper - 15 Shark - 17 Flounder - 8 Kingfish - 11arrow_forward
- n, where k is the percentile and n is the sample size. Given a sorted sample of 234 IQ scores, what is the value of the 40th percentile? 100 When finding the value of a percentile, the location of that value is L = Choose the correct answer below. O A. The 93rd IQ score in the sorted list O B. The 40th IQ score in the sorted list. O C. The 94th IQ score in the sorted list O D. The IQ score midway between the 40th and 41st scores in the sorted list.arrow_forwardAnxiety when taking math tests is a common problem. If I want to study this issue, which of the following describes the best way to find out the proportion of students who suffer from math anxiety? O Select students who have scored poorly in math classes at CCBC. Poll students as they enter campus on a randomly selected day. Talk to students randomly pulled from the list of all students. Interview students who have finals on the first day of finals week.arrow_forwardUse the sample data and confidence level given below to complete parts (a) through (d). A research institute poll asked respondents if they felt vulnerable to identity theft. In the poll, n = 1005 and x = 580 who said "yes." Use a 95% confidence level. Click the icon to view a table of z scores. a) Find the best point estimate of the population proportion p. (Round to three decimal places as needed.) ew an example Get more help. MacBook Air ... Clear all Chec.arrow_forward
arrow_back_ios
arrow_forward_ios
Recommended textbooks for you
- MATLAB: An Introduction with ApplicationsStatisticsISBN:9781119256830Author:Amos GilatPublisher:John Wiley & Sons Inc
 Probability and Statistics for Engineering and th...StatisticsISBN:9781305251809Author:Jay L. DevorePublisher:Cengage Learning
 Statistics for The Behavioral Sciences (MindTap C...StatisticsISBN:9781305504912Author:Frederick J Gravetter, Larry B. WallnauPublisher:Cengage Learning
  Elementary Statistics: Picturing the World (7th E...StatisticsISBN:9780134683416Author:Ron Larson, Betsy FarberPublisher:PEARSON
 The Basic Practice of StatisticsStatisticsISBN:9781319042578Author:David S. Moore, William I. Notz, Michael A. FlignerPublisher:W. H. Freeman
 Introduction to the Practice of StatisticsStatisticsISBN:9781319013387Author:David S. Moore, George P. McCabe, Bruce A. CraigPublisher:W. H. Freeman
MATLAB: An Introduction with Applications
Statistics
ISBN:9781119256830
Author:Amos Gilat
Publisher:John Wiley & Sons Inc
Probability and Statistics for Engineering and th...
Statistics
ISBN:9781305251809
Author:Jay L. Devore
Publisher:Cengage Learning
Statistics for The Behavioral Sciences (MindTap C...
Statistics
ISBN:9781305504912
Author:Frederick J Gravetter, Larry B. Wallnau
Publisher:Cengage Learning
Elementary Statistics: Picturing the World (7th E...
Statistics
ISBN:9780134683416
Author:Ron Larson, Betsy Farber
Publisher:PEARSON
The Basic Practice of Statistics
Statistics
ISBN:9781319042578
Author:David S. Moore, William I. Notz, Michael A. Fligner
Publisher:W. H. Freeman
Introduction to the Practice of Statistics
Statistics
ISBN:9781319013387
Author:David S. Moore, George P. McCabe, Bruce A. Craig
Publisher:W. H. Freeman