
MATLAB: An Introduction with Applications
6th Edition
ISBN: 9781119256830
Author: Amos Gilat
Publisher: John Wiley & Sons Inc
expand_more
expand_more
format_list_bulleted
Related questions
Question
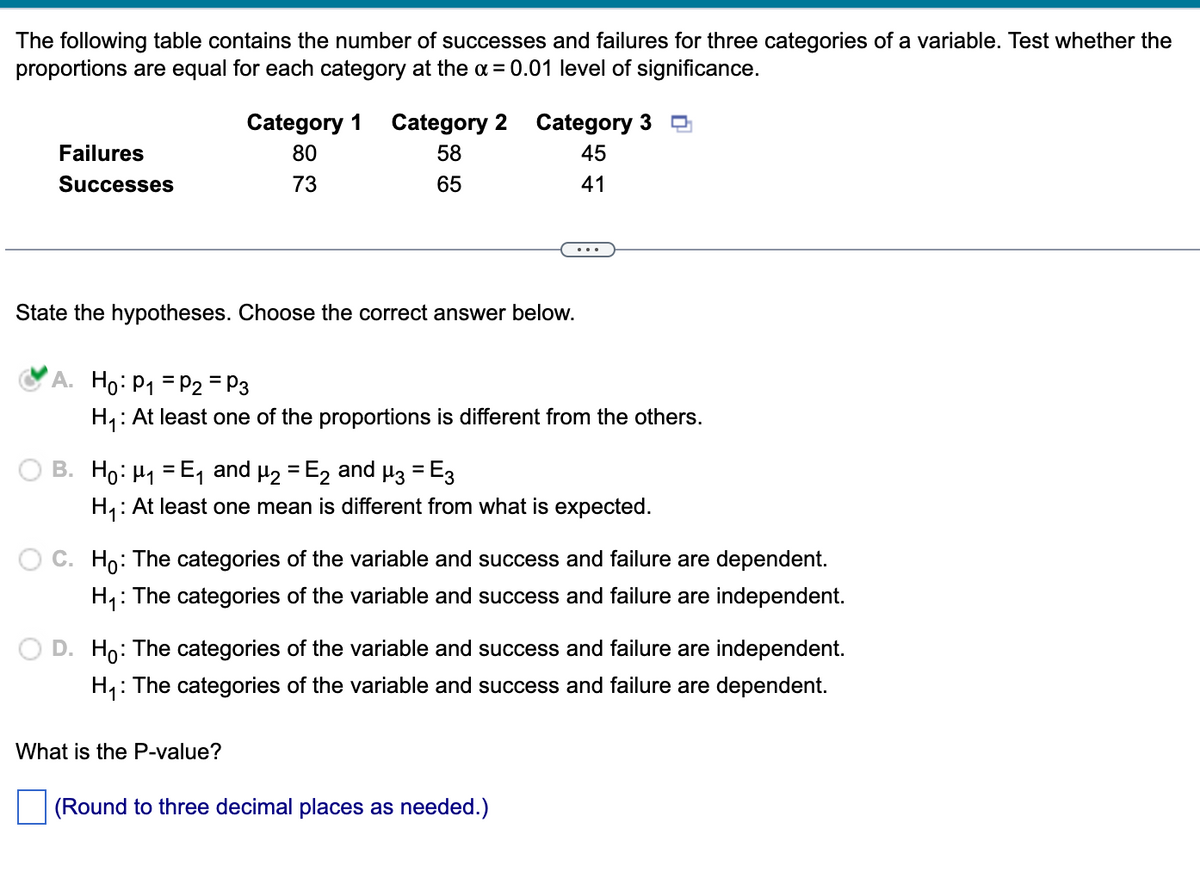

Transcribed Image Text:The following table contains the number of successes and failures for three categories of a variable. Test whether the
proportions are equal for each category at the α = 0.01 level of significance.
Failures
Successes
Category 1 Category 2
80
58
73
65
State the hypotheses. Choose the correct answer below.
Category 3
45
41
A. Ho: P₁ P2 = P3
H₁: At least one of the proportions is different from the others.
...
B. Ho: μ₁=E₁ and µ₂ = ₂ and µ3 = E3
H₁: At least one mean is different from what is expected.
What is the P-value?
C. Ho: The categories of the variable and success and failure are dependent.
H₁: The categories of the variable and success and failure are independent.
D. Ho: The categories of the variable and success and failure are independent.
H₁: The categories of the variable and success and failure are dependent.
(Round to three decimal places as needed.)
Expert Solution
This question has been solved!
Explore an expertly crafted, step-by-step solution for a thorough understanding of key concepts.

This is a popular solution

Trending nowThis is a popular solution!

Step by stepSolved in 3 steps with 3 images

Knowledge Booster

Similar questions
- 6- Hi Wonderful Bartleby Team (Thanks for all the help I do really aprecciate all you guys do) I need help with this exercise from stats. Thanks in advancearrow_forward(2.1)arrow_forwardThe following data are from a completely randomized design. In the following calculations, use a = 0.05. Treatment Treatment Treatment 1 3 62 82 69 46 73 53 53 89 61 39 60 45 50 76 57 96.67 156.67 106.67 (a) Use analysis of variance to test for a significant difference among the means of the three treatments. State the null and alternative hypotheses. O Ho: Not all the population means are equal. H3: H1 = H2 = H3 O Ho: Hq # Hz # H3 Ha: H1 = H2 = H3 O H: At least two of the population means are equal. H: At least two of the population means are different. O Ho: H1 = H2 = H3 H: Not all the population means are equal. O Ho: Hq = H2 = H3 Find the value of the test statistic. (Round your answer to two decimal places.) 6.03 Find the p-value. (Round your answer to three decimal places.) p-value = 0.022arrow_forward
- After you have clicked the tab for your selected topic and read the problem, answer the questions below. (a) Use SALT to summarize the data. Enter the sample size, number of success, and sample proportion, p for the data, rounded to three decimal places. Sample size Number Successes 4129 1938 0.4691 (b) Write the hypotheses to investigate the research question about the proportion, p, of successes. (Enter != for # as needed.) Ho: 0.4691 H: 0.05 (c) We need to verify the assumptions for using a z-test for a single proportion to analyze this dataset. the population of interest or the sample is The first assumption states the sample is a random sample selected in a way that should result in a representative sample. Based on what you know about how this sample was collected, the sample is a random sample from the populations of interest. The second assumption requires the sample to be large enough to be reasonably sure that the sampling distribution will be at least approximately normal.…arrow_forwardHi could you answer whats blank?arrow_forwarduppose you reject the null hypothesis H0: μ = 101. It turns out the population mean is actually equal to 101. You have made a Group of answer choices Type I and Type II errors the correct decision Type II error Type I errorarrow_forward
- p and z values pleasearrow_forwardScenario: 200 people were asked, “Who is your favorite superhero?” Below are the data. Test the null hypothesis that the population frequencies for each category are equal. α= .05. Iron Man Black Panther Wonder Woman Spiderman fo = 40 fo = 60 fo =55 fo = 45 fe = fe = fe = fe = Chi Square test statistic = ______ Group of answer choicesarrow_forward
arrow_back_ios
arrow_forward_ios
Recommended textbooks for you
- MATLAB: An Introduction with ApplicationsStatisticsISBN:9781119256830Author:Amos GilatPublisher:John Wiley & Sons Inc
 Probability and Statistics for Engineering and th...StatisticsISBN:9781305251809Author:Jay L. DevorePublisher:Cengage Learning
 Statistics for The Behavioral Sciences (MindTap C...StatisticsISBN:9781305504912Author:Frederick J Gravetter, Larry B. WallnauPublisher:Cengage Learning
  Elementary Statistics: Picturing the World (7th E...StatisticsISBN:9780134683416Author:Ron Larson, Betsy FarberPublisher:PEARSON
 The Basic Practice of StatisticsStatisticsISBN:9781319042578Author:David S. Moore, William I. Notz, Michael A. FlignerPublisher:W. H. Freeman
 Introduction to the Practice of StatisticsStatisticsISBN:9781319013387Author:David S. Moore, George P. McCabe, Bruce A. CraigPublisher:W. H. Freeman
MATLAB: An Introduction with Applications
Statistics
ISBN:9781119256830
Author:Amos Gilat
Publisher:John Wiley & Sons Inc
Probability and Statistics for Engineering and th...
Statistics
ISBN:9781305251809
Author:Jay L. Devore
Publisher:Cengage Learning
Statistics for The Behavioral Sciences (MindTap C...
Statistics
ISBN:9781305504912
Author:Frederick J Gravetter, Larry B. Wallnau
Publisher:Cengage Learning
Elementary Statistics: Picturing the World (7th E...
Statistics
ISBN:9780134683416
Author:Ron Larson, Betsy Farber
Publisher:PEARSON
The Basic Practice of Statistics
Statistics
ISBN:9781319042578
Author:David S. Moore, William I. Notz, Michael A. Fligner
Publisher:W. H. Freeman
Introduction to the Practice of Statistics
Statistics
ISBN:9781319013387
Author:David S. Moore, George P. McCabe, Bruce A. Craig
Publisher:W. H. Freeman