
MATLAB: An Introduction with Applications
6th Edition
ISBN: 9781119256830
Author: Amos Gilat
Publisher: John Wiley & Sons Inc
expand_more
expand_more
format_list_bulleted
Related questions
Question
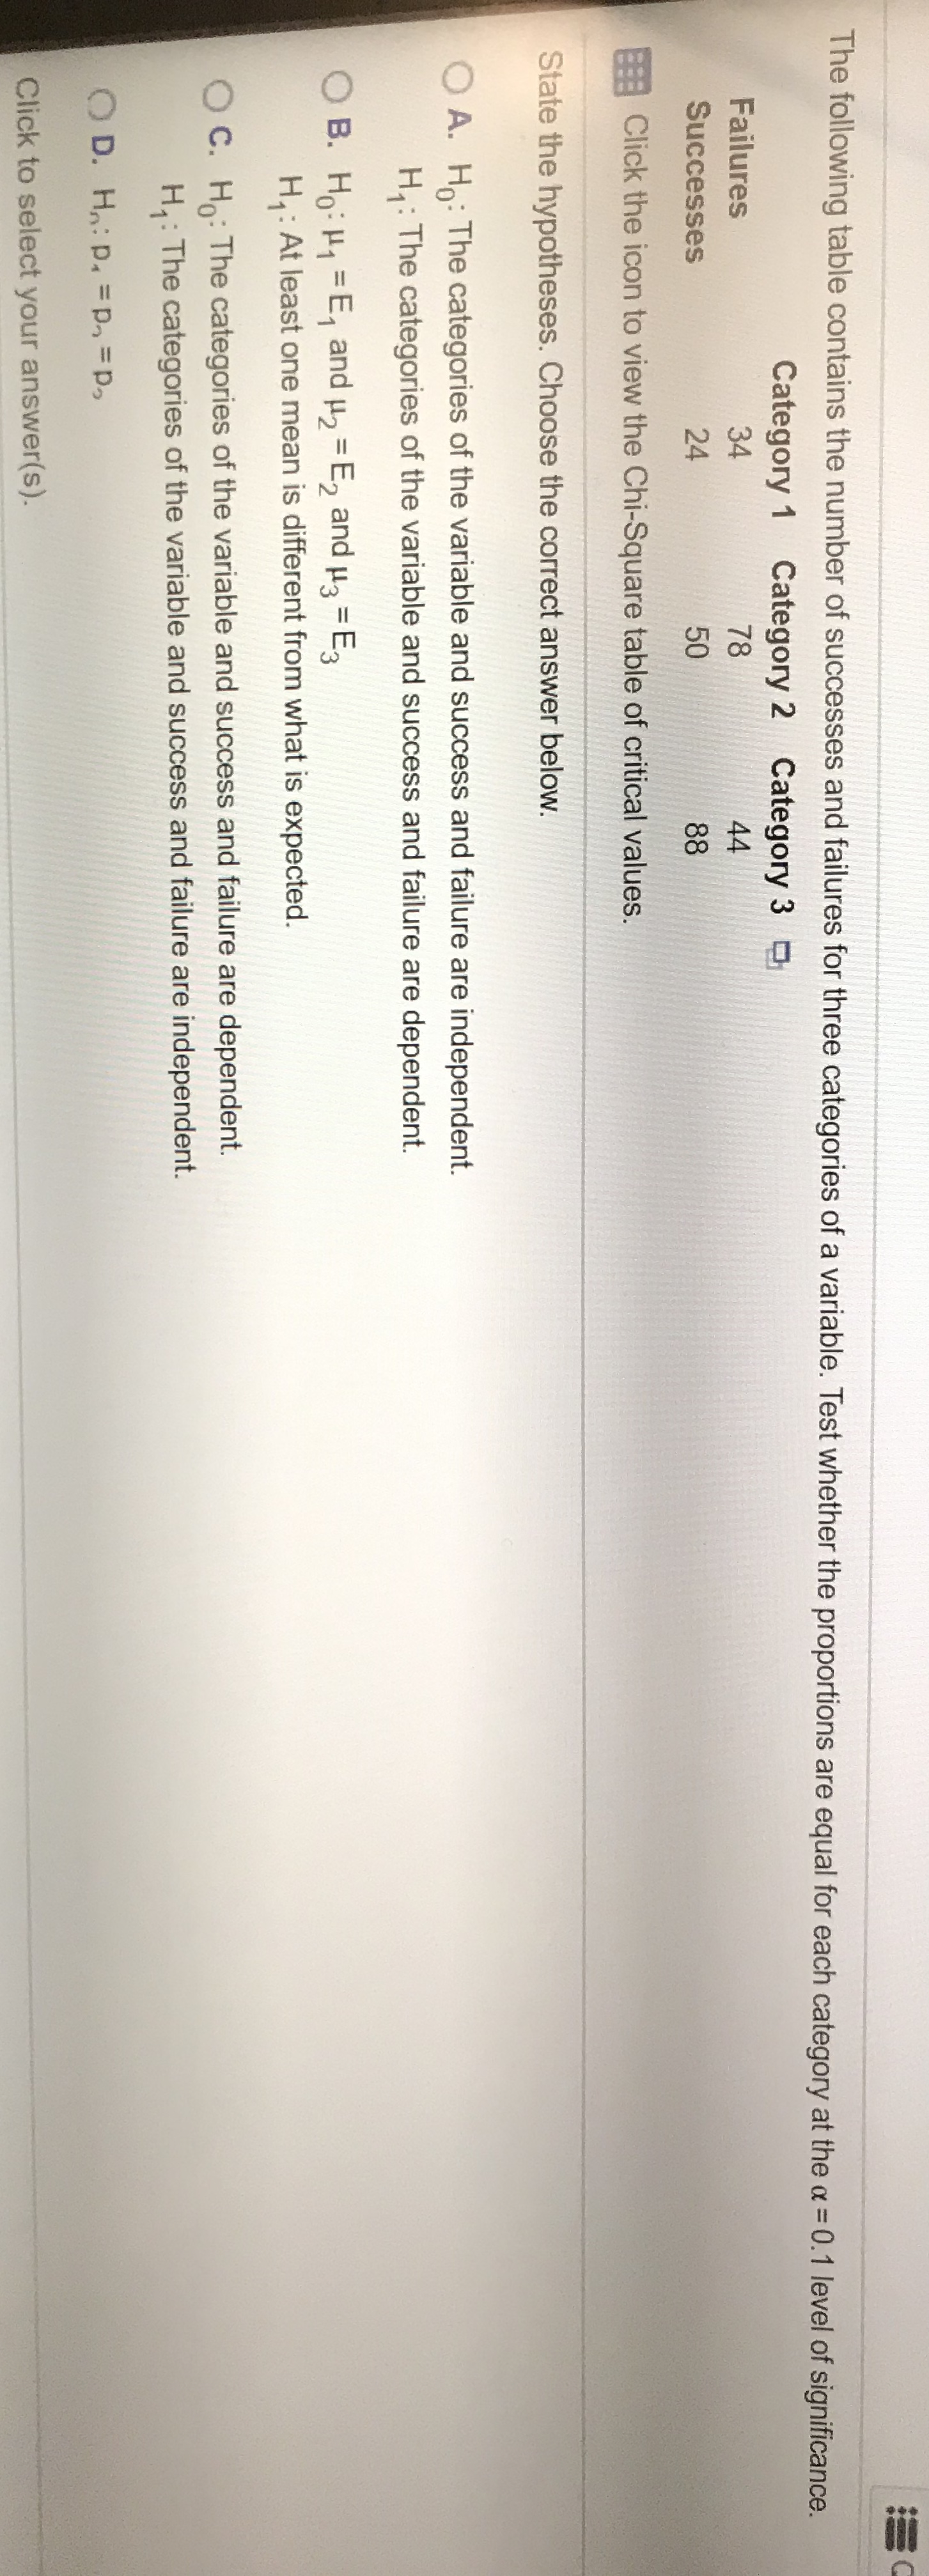

Transcribed Image Text:The following table contains the number of successes and failures for three categories of a variable. Test whether the proportions are equal for each category at the a = 0.1 level of significance.
Category
Category 2 Category
Failures
34
78
44
Successes
24
50
88
EClick the icon to view the Chi-Square table of critical values.
State the hypotheses. Choose the correct answer below
A. H:The categories of the variable and success and failure are independent.
H: The categories of the variable and success and failure are dependent.
B. Ho H1 E and u2 E2 and
H,: At least one mean is different from what is expected.
H3 E3
C. H: The categories of the variable and success and failure are dependent
H: The categories of the variable and success and failure are independent.
OD. H: p. pp
Click to select your answer(s).
Transcribed Image Text:y tabie co
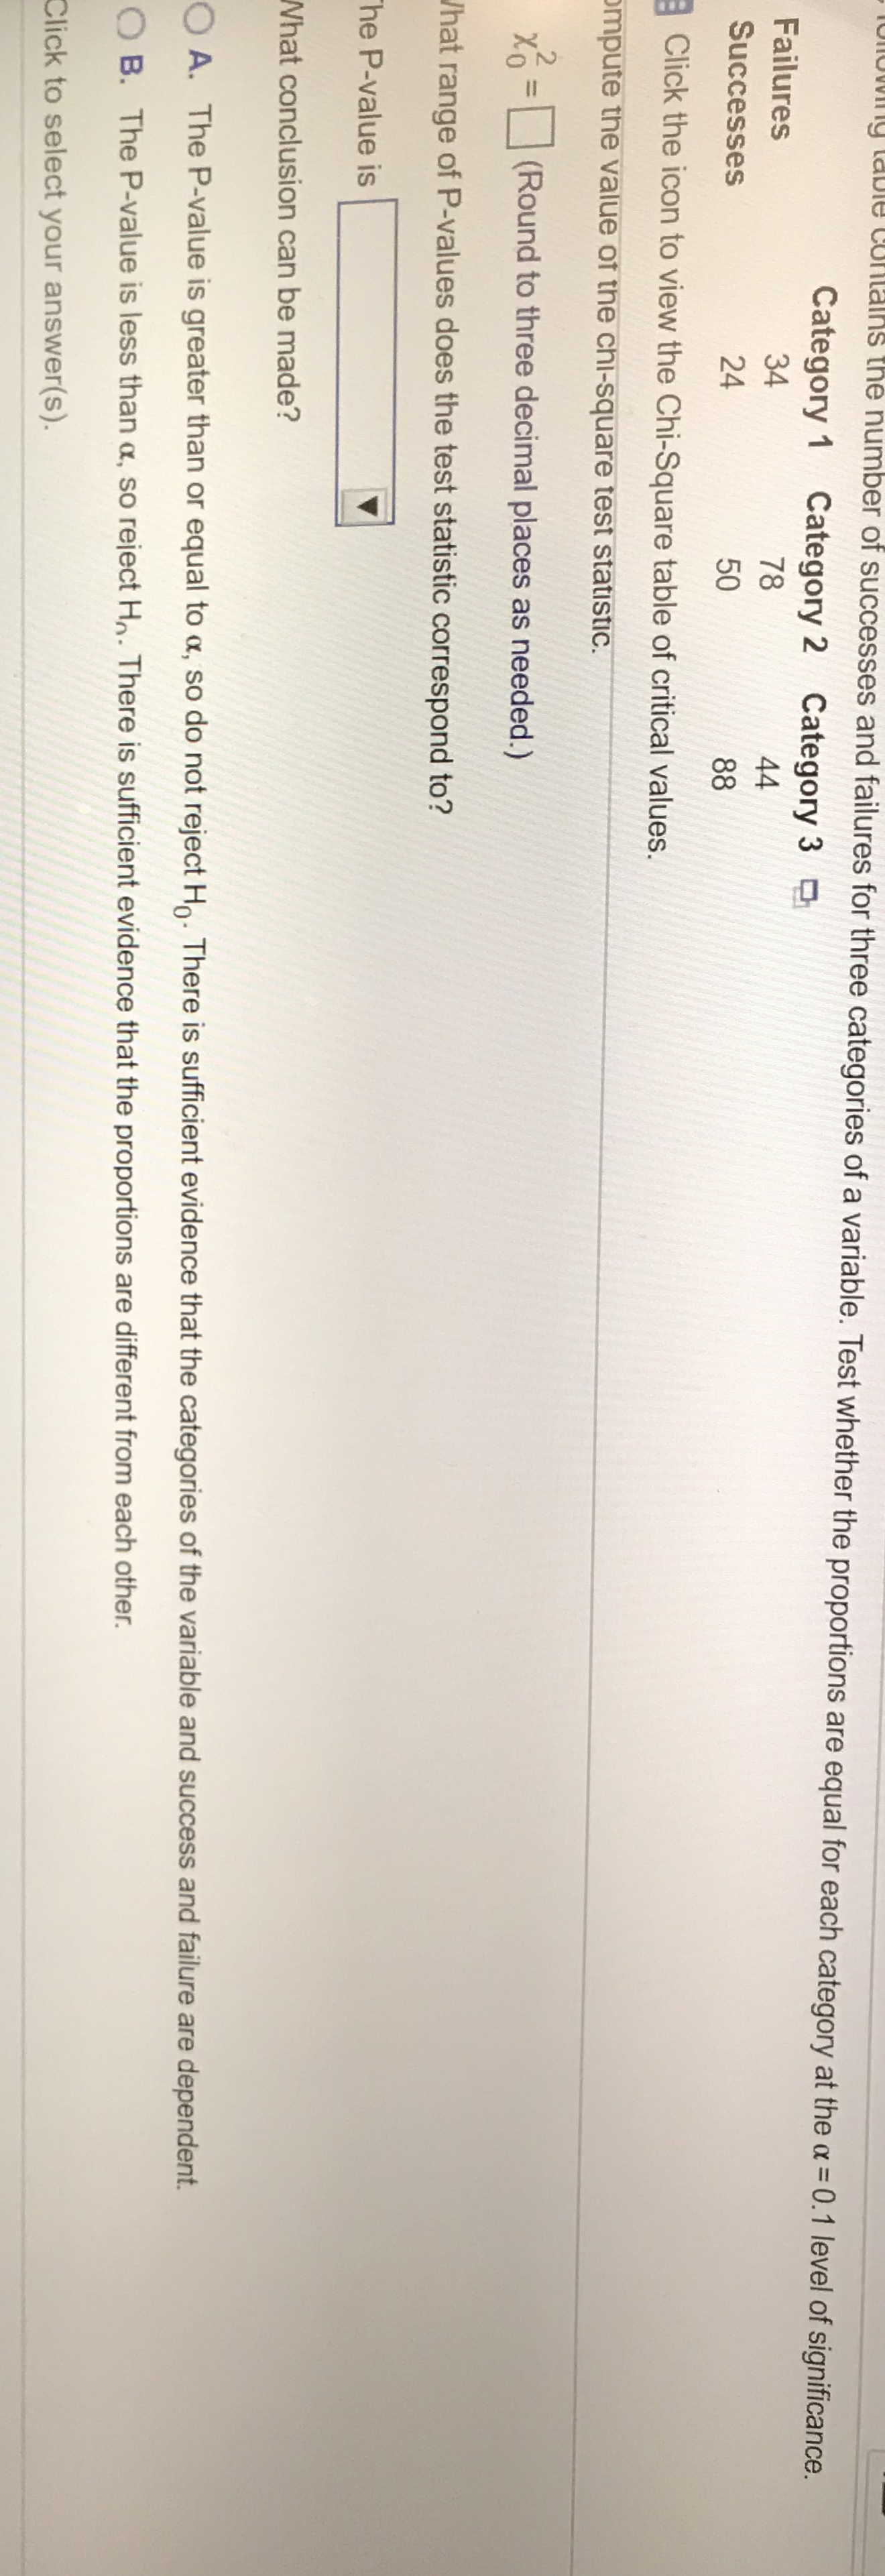
lns the number of successes and failures for three categories of a variable. Test whether the proportions are equal for each category at the a 0.1 level of significance.
oow
Category
Category 2 Category 3
Failures
34
78
44
Successes
24
50
88
Click the icon to view the Chi-Square table of critical values.
ompute the value of the chi-square test statistic
-
(Round to three decimal places as needed.)
Jhat range of P-values does the test statistic correspond to?
he P-value is
What conclusion can be made?
O A. The P-value is greater than or equal to a, so do not reject Ho. There is sufficient evidence that the categories of the variable and success and failure are dependent
O B. The P-value is less than a, so reject H. There is sufficient evidence that the proportions are different from each other.
Click to select your answer(s).
Expert Solution
This question has been solved!
Explore an expertly crafted, step-by-step solution for a thorough understanding of key concepts.

This is a popular solution

Trending nowThis is a popular solution!

Step by stepSolved in 5 steps with 3 images

Knowledge Booster

Similar questions
- Helparrow_forwardThe entering SAT scores and high school GPA’s of 100 first-year students and their grade point averages after one year at college are recorded. What type of statistical analysis is most appropriate if you want to use the data to make predictions on the college GPA for next year’s entering class. Assume the data is normal. Name of Test _____________________________________________arrow_forwardneed help please!arrow_forward
- The accompanying data represent the wait time (in minutes) for a random sample of 40 visitors to a popular attraction in a large amusement park. Use the sample data to complete parts (a) through (d). Click the icon to view the data for wait times. (Data table and histogram graphs attached)arrow_forwardConduct a multiple comparison test to determine if there is an overall best supplier or if one supplier can be eliminated because of poor quality. Use a 0.05 level of significance. (Round your answers for the critical values to four decimal places.) Comparison pi − pj CVij SignificantDiff > CVij A vs. B .01 0.0242 no A vs. C .05 0.0319 yes B vs. C .04 0.0336 yes Can any suppliers be eliminated because of poor quality? (Select all that apply.) Supplier A Supplier B Supplier C nonearrow_forwardVijayarrow_forward
- Find the 5 number summary for the data shown x 3.9 5.4 6.5 8.9 11.3 11.8 24.6 27.8 28.4 5 number summary:3.9 ____, ______, ______, 28.4Use the Locator/Percentile method described in your book, not your calculatorarrow_forwardFor each test below, describe what it is used for and to what type of data does it apply.(a) Rosner’s test(b) Grubb’s test(c) Dixon’s testarrow_forwardIs College Major qualitative or quantitative? What type of quantitative/qualitative variable is it? Is Commuting Time qualitative or quantitative? What type of quantitative/qualitative variable is it? Create a table with the absolute and relative frequencies of College Major. Screenshot attached thank youarrow_forward
- Q3: Calculates Mean, Median, Mode, Variance and Coefficient of variation. Also show that: Q1 = P25, D5= P50, Q3= P75 41-47 Classes 34-40 6. 8. 10 4 12 frequencyarrow_forwardhelparrow_forwardTrue or False? H0 for the sign test always states that the mean difference between the matched or paired samples is zero. 5arrow_forward
arrow_back_ios
SEE MORE QUESTIONS
arrow_forward_ios
Recommended textbooks for you
- MATLAB: An Introduction with ApplicationsStatisticsISBN:9781119256830Author:Amos GilatPublisher:John Wiley & Sons Inc
 Probability and Statistics for Engineering and th...StatisticsISBN:9781305251809Author:Jay L. DevorePublisher:Cengage Learning
 Statistics for The Behavioral Sciences (MindTap C...StatisticsISBN:9781305504912Author:Frederick J Gravetter, Larry B. WallnauPublisher:Cengage Learning
  Elementary Statistics: Picturing the World (7th E...StatisticsISBN:9780134683416Author:Ron Larson, Betsy FarberPublisher:PEARSON
 The Basic Practice of StatisticsStatisticsISBN:9781319042578Author:David S. Moore, William I. Notz, Michael A. FlignerPublisher:W. H. Freeman
 Introduction to the Practice of StatisticsStatisticsISBN:9781319013387Author:David S. Moore, George P. McCabe, Bruce A. CraigPublisher:W. H. Freeman
MATLAB: An Introduction with Applications
Statistics
ISBN:9781119256830
Author:Amos Gilat
Publisher:John Wiley & Sons Inc
Probability and Statistics for Engineering and th...
Statistics
ISBN:9781305251809
Author:Jay L. Devore
Publisher:Cengage Learning
Statistics for The Behavioral Sciences (MindTap C...
Statistics
ISBN:9781305504912
Author:Frederick J Gravetter, Larry B. Wallnau
Publisher:Cengage Learning
Elementary Statistics: Picturing the World (7th E...
Statistics
ISBN:9780134683416
Author:Ron Larson, Betsy Farber
Publisher:PEARSON
The Basic Practice of Statistics
Statistics
ISBN:9781319042578
Author:David S. Moore, William I. Notz, Michael A. Fligner
Publisher:W. H. Freeman
Introduction to the Practice of Statistics
Statistics
ISBN:9781319013387
Author:David S. Moore, George P. McCabe, Bruce A. Craig
Publisher:W. H. Freeman