Question

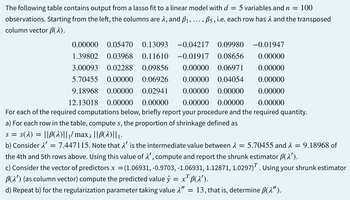
Transcribed Image Text:The following table contains output from a lasso fit to a linear model with d = 5 variables and n = 100
observations. Starting from the left, the columns are λ, and B1, ..., ß5, i.e. each row has λ and the transposed
column vector B(λ).
0.00000 0.05470 0.13093 -0.04217 0.09980 -0.01947
1.39802 0.03968 0.11610 -0.01917 0.08656 0.00000
3.00093 0.02288 0.09856 0.00000 0.06971 0.00000
5.70455 0.00000 0.06926 0.00000 0.04054 0.00000
9.18968 0.00000 0.02941 0.00000 0.00000 0.00000
12.13018 0.00000 0.00000 0.00000 0.00000 0.00000
For each of the required computations below, briefly report your procedure and the required quantity.
a) For each row in the table, compute s, the proportion of shrinkage defined as
s = s(λ) = ||B(2)||1/ max 2 ||B(2)||1 ·
b) Consider λ = 7.447115. Note that λ' is the intermediate value between λ = 5.70455 and λ = 9.18968 of
the 4th and 5th rows above. Using this value of 1', compute and report the shrunk estimator ß(λ′).
c) Consider the vector of predictors x = (1.06931, -0.9703, -1.06931, 1.12871, 1.0297). Using your shrunk estimator
B(λ') (as column vector) compute the predicted value ŷ = x²ß(X′).
d) Repeat b) for the regularization parameter taking value λ"
=
13, that is, determine ẞ(λ").
Expert Solution
This question has been solved!
Explore an expertly crafted, step-by-step solution for a thorough understanding of key concepts.
Step by stepSolved in 2 steps

Knowledge Booster
Similar questions
- How do I code this in MATLAB?arrow_forwardTo compute the average of the squares of the elements of a vector V, aka the mean square, we (Note: use randn to create a random vector) Select one: a. We use polyfit which does least squares and skip the minimization part b.we use sum(V.^2)./length(V*V) c.we use sum(V.*V)/length(V) d.we use mean(V) e.we use sum(V^2)/length(V)arrow_forwardPYTHON JUPYTER NOTEBOOKS please show code clearly. create a program for lower triangular system L x = b. The algorithm is described in the image for i and j with offset 1. Recall that NumPy and Python have offset 0 for their sequence data types.arrow_forward
- Horizontal sequence :RIVL Vertical sequence:FMK Scoring rules: g/o = -3, g/e = -1, match or mismatch - from PAM250 substitution matrix below. NW algorithm. 1. Complete the scoring matrix. Scoring matrix with PAM250 scores: R I V L F M K 2. Set up, initialize and complete the NW matrix. 3. Retrace, align and score alignment(s). Use the arrows and circles for the matrix and path(s). R I V L F M K Align and score all optimal alignments here. PLZ the arrows and circles for the matrix and path(s) AND SHOW ALL possible Alignmentarrow_forwardUse Matlab to Plot the graph shown in image 2 using data in table on image 1, BMI= W*H Where W is the weight in kilograms and H is the height in meters. Or the four color curves, use the line width ‘3’. To display a BMI of a person use the following: circular MarkSize ‘8’, MarkerEdgeColor ‘cyan’. To display this you have to enter two values. these are the Height in meters and Weight in kilograms. And inform the outcome results to the person from the command window.arrow_forwardLeast Squares Regression 1. In MATLAB Write a function to calculate the slope and intercept for a best-fit line using the least-squares linear regression method and to calculate the R2 value. Your inputs should be arrays of X- and Y-values. Your outputs should be the slope and intercept and the R2 value. Sectionarrow_forward
- PEAR: sort the data according to the employees salary (the last column). Use the Schwartzian transform method.arrow_forwardGiven an array of integers, print a sum triangle from it such that the first level has all array elements. From then, at each level number of elements is one less than the previous level and elements at the level is be the Sum of consecutive two elements in the previous level. Input The single line of input contains an array of integers, each of it is separated by space Output Triangle form that has been created from the input array Sample Input1 12345 Sample Output1 48 20 28 8 12 16 3579 12345arrow_forwardCan you help me for Questu=ion 1, 2, 3a, 3b, 3c, 3d and 3e?arrow_forward
arrow_back_ios
arrow_forward_ios