Advanced Engineering Mathematics
10th Edition
ISBN: 9780470458365
Author: Erwin Kreyszig
Publisher: Wiley, John & Sons, Incorporated
expand_more
expand_more
format_list_bulleted
Concept explainers
Question
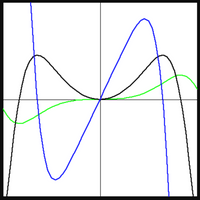
The following shows graphs of three functions, A (in black), B (in blue), and C (in green). If these are the graphs of three functions f, f' , and f'' , identify which is which.

Transcribed Image Text:The image displays a graph with three different colored curves on a Cartesian plane.
1. **Axis Details**:
- The graph has both x and y axes with a grid backdrop, and the axes intersect at the origin (0,0).
- The grid is divided into quadrants, aiding in visualizing the curves.
2. **Curve Descriptions**:
- **Blue Curve**:
- This curve has a steep upward and downward trajectory with two prominent humps indicating key turning points or critical points.
- It crosses the x-axis at one point in the displayed section.
- **Black Curve**:
- This curve has a smoother and broader peak than the blue curve, suggesting a gentler rate of change.
- It also intersects the x-axis, showing at least one real root within the visible part.
- **Green Curve**:
- The green curve is the most gradual, with a slight wave pattern indicating lesser variation compared to the blue and black curves.
- It also appears to intersect the x-axis once within the range shown.
3. **Overall Description**:
- The curves likely represent different mathematical functions, showing varying degrees of complexity and behavior such as multiple turning points and intercepts.
- The visual differences highlight contrasts in growth rates and critical points, useful for comparing polynomial or trigonometric function behavior in mathematics.
These diagrams can be used to teach concepts related to graphing functions, analyzing intercepts, critical points, and the general behavior of mathematical functions.
Expert Solution
This question has been solved!
Explore an expertly crafted, step-by-step solution for a thorough understanding of key concepts.
This is a popular solution
Trending nowThis is a popular solution!
Step by stepSolved in 2 steps

Knowledge Booster
Learn more about
Need a deep-dive on the concept behind this application? Look no further. Learn more about this topic, advanced-math and related others by exploring similar questions and additional content below.Similar questions
- Given the following graph y ^ 4 NU 2 f(x) >x 4 -2 2 4 2 Graph the inversearrow_forwardThe function f is defined by f(x) = -x³ - 4x + 5 and the point (-1, 10) is on the graph of f. If g is the inverse function of f, what is the value of g'(10)?arrow_forward6) Does y = x have an inverse function?arrow_forward
Recommended textbooks for you
 Advanced Engineering MathematicsAdvanced MathISBN:9780470458365Author:Erwin KreyszigPublisher:Wiley, John & Sons, Incorporated
 Numerical Methods for EngineersAdvanced MathISBN:9780073397924Author:Steven C. Chapra Dr., Raymond P. CanalePublisher:McGraw-Hill Education
 Introductory Mathematics for Engineering Applicat...Advanced MathISBN:9781118141809Author:Nathan KlingbeilPublisher:WILEY
 Mathematics For Machine TechnologyAdvanced MathISBN:9781337798310Author:Peterson, John.Publisher:Cengage Learning,


Advanced Engineering Mathematics
Advanced Math
ISBN:9780470458365
Author:Erwin Kreyszig
Publisher:Wiley, John & Sons, Incorporated

Numerical Methods for Engineers
Advanced Math
ISBN:9780073397924
Author:Steven C. Chapra Dr., Raymond P. Canale
Publisher:McGraw-Hill Education

Introductory Mathematics for Engineering Applicat...
Advanced Math
ISBN:9781118141809
Author:Nathan Klingbeil
Publisher:WILEY

Mathematics For Machine Technology
Advanced Math
ISBN:9781337798310
Author:Peterson, John.
Publisher:Cengage Learning,

