MATLAB: An Introduction with Applications
6th Edition
ISBN: 9781119256830
Author: Amos Gilat
Publisher: John Wiley & Sons Inc
expand_more
expand_more
format_list_bulleted
Question

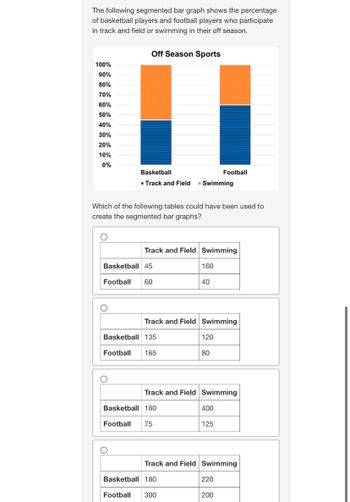
Transcribed Image Text:The following segmented bar graph shows the percentage
of basketball players and football players who participate
in track and field or swimming in their off season.
100%
90%
80%
70%
60%
50%
40%
30%
20%
10%
0%
Off Season Sports
Basketball
■ Track and Field ▪ Swimming
Which of the following tables could have been used to
create the segmented bar graphs?
Track and Field Swimming
Basketball 45
Football 60
Basketball 135
Football 165
160
Track and Field Swimming
Basketball 180
Football 75
40
Basketball 180
Football 300
120
80
Track and Field Swimming
Football
400
125
Track and Field Swimming
220
200
Expert Solution
This question has been solved!
Explore an expertly crafted, step-by-step solution for a thorough understanding of key concepts.
This is a popular solution
Trending nowThis is a popular solution!
Step by stepSolved in 2 steps

Knowledge Booster
Similar questions
- In a survey, 2400 zoo attendees are asked to choose their favorite. The results are shown in the following table. (a) Find the percentage for each type of animal. Number of zoo attendees Type of animal Percentage % Кoala 216 Jaguar 384 % Anteater 1104 Gorilla 696 (b) Construct a percent bar graph for the data. 25% 25% 25% 25% Drag to adjust 0% 25% 50% 75% 100% Кoala Jaquar Anteater Gorillaarrow_forwardThe ages of people at a family party are listed. Construct an ordered stem-and-leaf diagram for the given data. Don’t forget to include your rough draft. You may want to do this on graph paper.34 54 17 26 34 25 14 24 25 23 20 18 25 19 27 26 35 36arrow_forwardConstruct a graph that best demonstrates the underlying trend of the following data about eagles in the US. What are the two locations that show the lowest proportion of Avian Pox? Location Total Eagles Eagles with Avian Pox Northeast 121 8 Southeast 283 12 North Central 541 28 South Central 501 36 Northwest 343 24 Southwest 112 20 Alaska 503 8 Construct a very simple bar graph that best demonstrates the number of injuries that occurred for each sport. Sport Injuries Baseball 165,842 Basketball 501,251 Bowling 20,878 Football 451,961 Ice Hockey 19,035 Soccer 208,214 Softball 121,175 Tennis 23,611 Volleyball 60,159arrow_forward
- Students at a high school were polled to determine the type of music they preferred. There were 1960 students who completed the poll. Their responses are represented in the circle graph. Music Preferences O Rap 906 O Alternative 478 What percent of students preferred country music? Rock and Roll 280 Country 166 Jazz 35 Other 95 ..... About % of the students who completed the poll preferred country music. (Round to one decimal place as needed.)arrow_forwardThe weights (to the nearest five pounds) of 30 randomly selected male college students are organized in the histogram. Use the graph to find the median weight. The median weight is pounds. (Type an integer or a decimal.) C Students (frequency) Number 10- 8+ 6- 4- Weight of 30 Male College Students 110 115 120 125 130 135 140 145 150 155 160 165 Weight (pounds) ONarrow_forwardGraph the set of data using the appropriate type of graph (bar graph, line graph, scatter graph, or pie chart) TABLE 5 Favorite Vegetables Boys Girls Broccoli 2 5 Carrots 6 7 Corn 10 8 Peas 8 5 Squash 5 6arrow_forward
- Please do not give solution in image format thankuarrow_forwardI am doing a persuasive speech on the increase in student loan debt. I want to use a graph that shows the increase over the decades from the 1970s to now which type of graph would be most appropriate for this type of data? A- a pie chart B- line graph C- bar grapharrow_forwardhelp pleasearrow_forward
- The data in the picture contains purchase data for golf purchases. Create a doughnut chart in Excel to compare the purchases by gender each year with the US population. Below the chart, explain what it illustrates.arrow_forwardGraph the data in a scatter diagram: Age Calories 765 1520 15 2540 500 5. 795 17 2350 6. 1900 Use the paperclip button below to attach files. XDG BIUに ..arrow_forward
arrow_back_ios
arrow_forward_ios
Recommended textbooks for you
 MATLAB: An Introduction with ApplicationsStatisticsISBN:9781119256830Author:Amos GilatPublisher:John Wiley & Sons Inc
 Probability and Statistics for Engineering and th...StatisticsISBN:9781305251809Author:Jay L. DevorePublisher:Cengage Learning
 Statistics for The Behavioral Sciences (MindTap C...StatisticsISBN:9781305504912Author:Frederick J Gravetter, Larry B. WallnauPublisher:Cengage Learning
 Elementary Statistics: Picturing the World (7th E...StatisticsISBN:9780134683416Author:Ron Larson, Betsy FarberPublisher:PEARSON
 The Basic Practice of StatisticsStatisticsISBN:9781319042578Author:David S. Moore, William I. Notz, Michael A. FlignerPublisher:W. H. Freeman
 Introduction to the Practice of StatisticsStatisticsISBN:9781319013387Author:David S. Moore, George P. McCabe, Bruce A. CraigPublisher:W. H. Freeman

MATLAB: An Introduction with Applications
Statistics
ISBN:9781119256830
Author:Amos Gilat
Publisher:John Wiley & Sons Inc

Probability and Statistics for Engineering and th...
Statistics
ISBN:9781305251809
Author:Jay L. Devore
Publisher:Cengage Learning

Statistics for The Behavioral Sciences (MindTap C...
Statistics
ISBN:9781305504912
Author:Frederick J Gravetter, Larry B. Wallnau
Publisher:Cengage Learning

Elementary Statistics: Picturing the World (7th E...
Statistics
ISBN:9780134683416
Author:Ron Larson, Betsy Farber
Publisher:PEARSON

The Basic Practice of Statistics
Statistics
ISBN:9781319042578
Author:David S. Moore, William I. Notz, Michael A. Fligner
Publisher:W. H. Freeman

Introduction to the Practice of Statistics
Statistics
ISBN:9781319013387
Author:David S. Moore, George P. McCabe, Bruce A. Craig
Publisher:W. H. Freeman