
MATLAB: An Introduction with Applications
6th Edition
ISBN: 9781119256830
Author: Amos Gilat
Publisher: John Wiley & Sons Inc
expand_more
expand_more
format_list_bulleted
Related questions
Question
17) The following results are from data where the dependent variable is the selling price of used cars, the independent variables are similar to those in the above regression along with some additional variables. The data were split into 2 samples and the following regression results were obtained from the split data. If we wanted to test for heteroscedasticity, what is the test statistic?
(please round your answer to 2 decimal places)
**I explicitly need to know the test statistic**
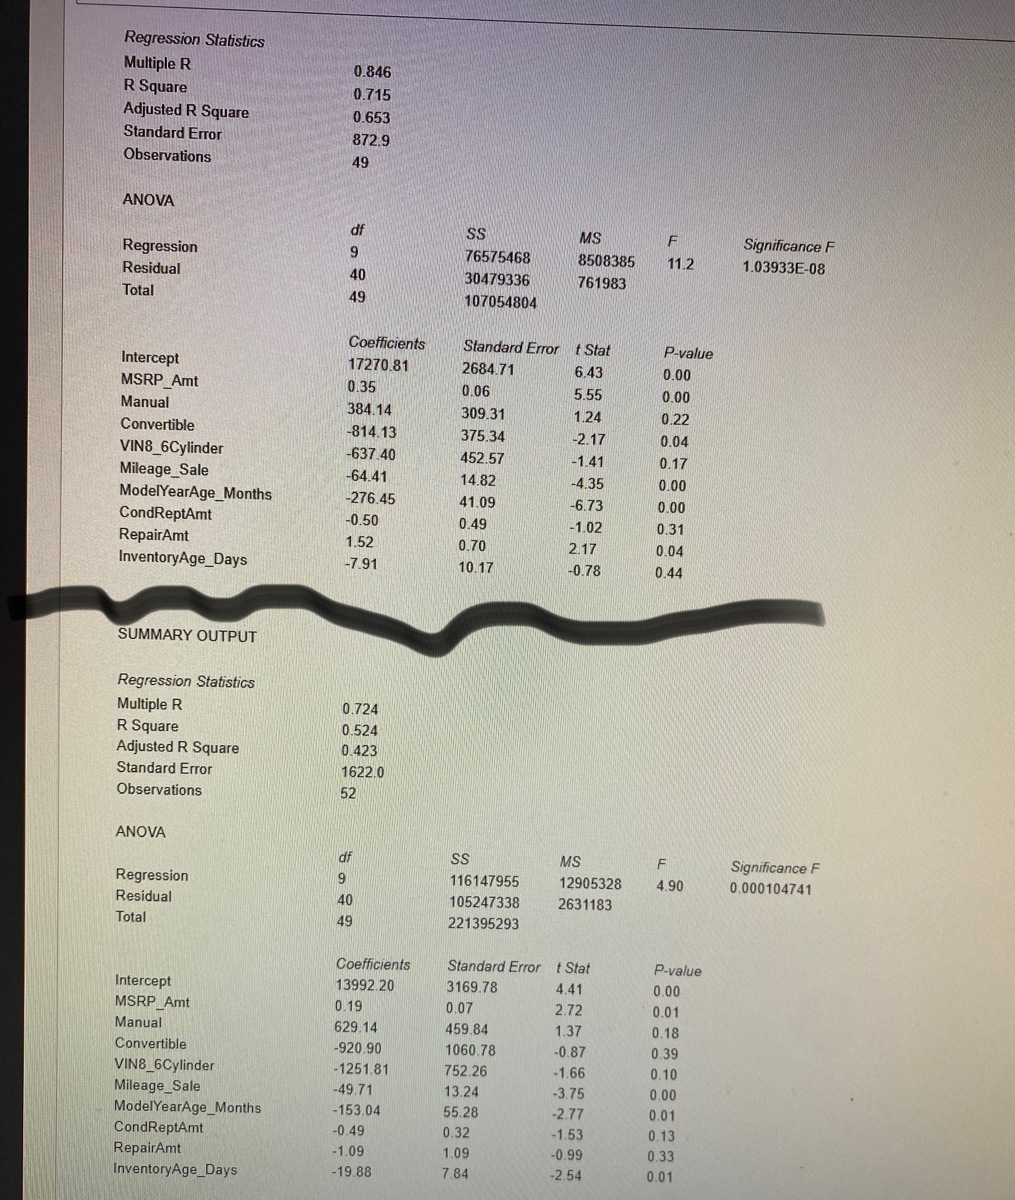

Transcribed Image Text:Regression Statistics
Multiple R
R Square
Adjusted R Square
Standard Error
0.846
0.715
0.653
872.9
Observations
49
ANOVA
df
SS
MS
Regression
6.
Significance F
76575468
8508385
11.2
Residual
1.03933E-08
40
30479336
761983
Total
49
107054804
Coefficients
Standard Error t Stat
P-value
Intercept
MSRP_Amt
17270.81
2684.71
6.43
0.00
0.35
0.06
Manual
5.55
0.00
384.14
309.31
Convertible
1.24
0.22
-814.13
375.34
-2.17
0.04
VIN8_6Cylinder
Mileage_Sale
ModelYearAge_Months
CondReptAmt
RepairAmt
InventoryAge_Days
-637.40
452.57
-1.41
0.17
-64.41
14.82
-4.35
0.00
-276.45
41.09
-6.73
0.00
-0.50
0.49
-1.02
0.31
1.52
0.70
2.17
0.04
-7.91
10.17
-0.78
0.44
SUMMARY OUTPUT
Regression Statistics
Multiple R
R Square
Adjusted R Square
0.724
0.524
0.423
Standard Error
1622.0
Observations
52
ANOVA
df
MS
Significance F
Regression
Residual
116147955
12905328
4.90
0.000104741
40
105247338
2631183
Total
49
221395293
Coefficients
Standard Error t Stat
P-value
Intercept
MSRP_Amt
13992.20
3169.78
4.41
0.00
0.19
0.07
2.72
0.01
Manual
629.14
459.84
1.37
0.18
Convertible
-920.90
1060.78
-0.87
0.39
VIN8_6Cylinder
Mileage_Sale
ModelYearAge_Months
CondReptAmt
RepairAmt
InventoryAge_Days
-1251.81
752.26
-1.66
0.10
-49.71
13.24
-3.75
0.00
-153.04
55.28
-2.77
0.01
-0.49
0.32
-1.53
0.13
-1.09
1.09
-0.99
0.33
-19.88
7.84
-2,54
0.01
Expert Solution
This question has been solved!
Explore an expertly crafted, step-by-step solution for a thorough understanding of key concepts.

This is a popular solution

Trending nowThis is a popular solution!

Step by stepSolved in 3 steps

Knowledge Booster

Similar questions
- Here are the scatter plots for two sets of bivariate data with the same response variable. The first compares the variables (please look at snip of problem downloaded below in "Add Image")arrow_forwardHi, I am having trouble finding the P-value for this problem. Could you please explain step by step how will I figure out the P-value? Thanks.arrow_forwardWhat are two reasons null effects can happen? How can you increase the power of a statistical test and why do they increase it?arrow_forward
- Several bakeries in a town were asked the price for different amounts of donuts at their shop. The scatter plot with Total Cost (in dollars) 876543 ~ TO 0 0 1 Donut Pricing 2 3 4 5 Number of Donuts 6 7 8 line of best fit was created from the data gathered. Part A: Estimate the correlation coefficient. Explain your reasoning for the given value. Part B: How many positive and negative residuals are there? Explain your reasoning. Part C: State the point with the largest absolute value residual and interpret the point in terms of the context of the data.arrow_forwardwhat is the indepedent variable and dependent variable in this question " Why does Los Angeles County have more Covid 19 cases then Kern County"?arrow_forwardDescribe a situation where you would use a test of significance on the difference between the means of two populations by stating a pair of populations composed of the same type of individuals and a quantitative variable on those populations. You may want to mention hypotheses, the sizes of samples from those populations, and the degrees of freedom of your test statistic.arrow_forward
arrow_back_ios
arrow_forward_ios
Recommended textbooks for you
- MATLAB: An Introduction with ApplicationsStatisticsISBN:9781119256830Author:Amos GilatPublisher:John Wiley & Sons Inc
 Probability and Statistics for Engineering and th...StatisticsISBN:9781305251809Author:Jay L. DevorePublisher:Cengage Learning
 Statistics for The Behavioral Sciences (MindTap C...StatisticsISBN:9781305504912Author:Frederick J Gravetter, Larry B. WallnauPublisher:Cengage Learning
  Elementary Statistics: Picturing the World (7th E...StatisticsISBN:9780134683416Author:Ron Larson, Betsy FarberPublisher:PEARSON
 The Basic Practice of StatisticsStatisticsISBN:9781319042578Author:David S. Moore, William I. Notz, Michael A. FlignerPublisher:W. H. Freeman
 Introduction to the Practice of StatisticsStatisticsISBN:9781319013387Author:David S. Moore, George P. McCabe, Bruce A. CraigPublisher:W. H. Freeman
MATLAB: An Introduction with Applications
Statistics
ISBN:9781119256830
Author:Amos Gilat
Publisher:John Wiley & Sons Inc
Probability and Statistics for Engineering and th...
Statistics
ISBN:9781305251809
Author:Jay L. Devore
Publisher:Cengage Learning
Statistics for The Behavioral Sciences (MindTap C...
Statistics
ISBN:9781305504912
Author:Frederick J Gravetter, Larry B. Wallnau
Publisher:Cengage Learning
Elementary Statistics: Picturing the World (7th E...
Statistics
ISBN:9780134683416
Author:Ron Larson, Betsy Farber
Publisher:PEARSON
The Basic Practice of Statistics
Statistics
ISBN:9781319042578
Author:David S. Moore, William I. Notz, Michael A. Fligner
Publisher:W. H. Freeman
Introduction to the Practice of Statistics
Statistics
ISBN:9781319013387
Author:David S. Moore, George P. McCabe, Bruce A. Craig
Publisher:W. H. Freeman