
MATLAB: An Introduction with Applications
6th Edition
ISBN: 9781119256830
Author: Amos Gilat
Publisher: John Wiley & Sons Inc
expand_more
expand_more
format_list_bulleted
Related questions
Question
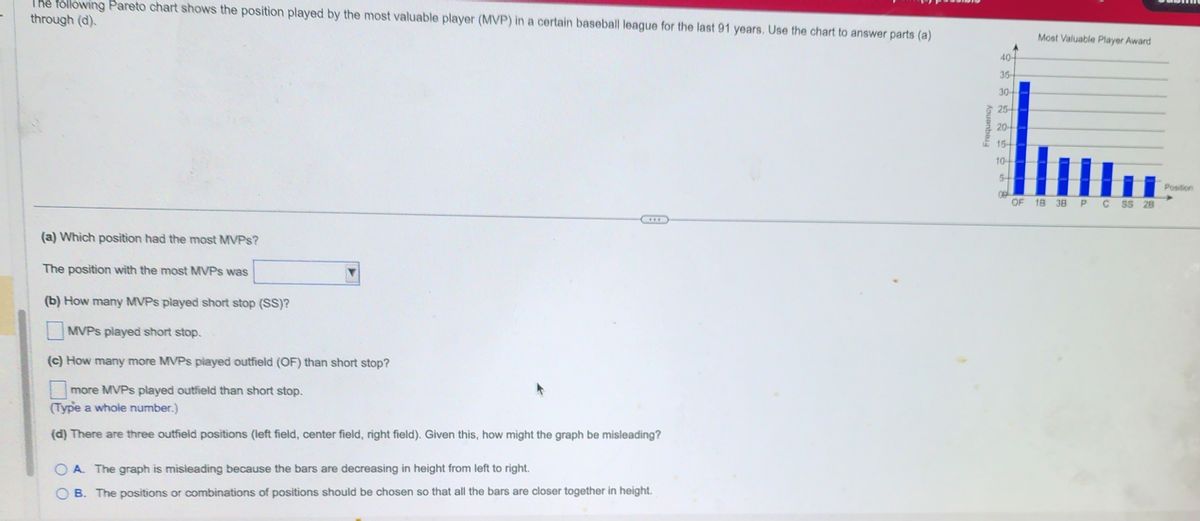

Transcribed Image Text:The following Pareto chart shows the position played by the most valuable player (MVP) in a certain baseball league for the last 91 years. Use the chart to answer parts (a)
through (d).
(a) Which position had the most MVPs?
The position with the most MVPs was
(b) How many MVPs played short stop (SS)?
MVPs played short stop.
(c) How many more MVPs played outfield (OF) than short stop?
more MVPs played outfield than short stop.
(Type a whole number.)
(d) There are three outfield positions (left field, center field, right field). Given this, how might the graph be misleading?
OA. The graph is misleading because the bars are decreasing in height from left to right.
OB. The positions or combinations of positions should be chosen so that all the bars are closer together in height.
Frequency
40-
35-
30-
25-
20
15-
104
54
00
Most Valuable Player Award
.....
OF 18 38 PC SS 28
Position
Expert Solution
This question has been solved!
Explore an expertly crafted, step-by-step solution for a thorough understanding of key concepts.

This is a popular solution

Trending nowThis is a popular solution!

Step by stepSolved in 6 steps with 1 images

Knowledge Booster

Similar questions
- A professor wanted to study the number of hours statistics students spend studyingstatistics each week. Out of 19 statistics sections at Santa Ana College, the professorsurveyed each student from 3 randomly selected sections. What is the largest group ofstudents the results of this study can represent?a. All Santa Ana College studentsb. All Santa Ana College students taking a math classc. All Santa Ana College students taking a statistics classd. Students in the three sections the professor surveyedarrow_forwardby which criteria?arrow_forwardin a survey of 14 college students, it was found that 9 were taking an English class, 7 were taking a math class, and 6 were taking both English and math. How many students were taking a math class only? How many students were taking an English class only? How many students were taking neither.arrow_forward
- At a certain university, 77.6% of 20,712 students were undergraduates in fall semester of a given year. How many undergraduates were there? There were O undergraduates. (Round to the nearest person as needed.) Activate Windowsarrow_forwardFind the number of full houses in a poker hand, that is, the number of poker hands with three of a kind and two of a kind.arrow_forwardHow many ways can the positions of center midfielder, striker, and center back be assigned from the starting ten field players of a soccer team?arrow_forward
- A school newspaper reporter decides to randomly survey 17 students to see if they will attend Tet (Vietnamese New Year) festivities this year. Based on past years, she knows that 11% of students attend Tet festivities. We are interested in the number of students who will attend the festivities. How many of the 17 students do we expect to attend the festivities?arrow_forwardThe u for days absent from class per month is 4.3. The teacher begins a policy of pop quizzes to see if it affects attendance. What are Ha and Ho?arrow_forward
arrow_back_ios
arrow_forward_ios
Recommended textbooks for you
- MATLAB: An Introduction with ApplicationsStatisticsISBN:9781119256830Author:Amos GilatPublisher:John Wiley & Sons Inc
 Probability and Statistics for Engineering and th...StatisticsISBN:9781305251809Author:Jay L. DevorePublisher:Cengage Learning
 Statistics for The Behavioral Sciences (MindTap C...StatisticsISBN:9781305504912Author:Frederick J Gravetter, Larry B. WallnauPublisher:Cengage Learning
  Elementary Statistics: Picturing the World (7th E...StatisticsISBN:9780134683416Author:Ron Larson, Betsy FarberPublisher:PEARSON
 The Basic Practice of StatisticsStatisticsISBN:9781319042578Author:David S. Moore, William I. Notz, Michael A. FlignerPublisher:W. H. Freeman
 Introduction to the Practice of StatisticsStatisticsISBN:9781319013387Author:David S. Moore, George P. McCabe, Bruce A. CraigPublisher:W. H. Freeman
MATLAB: An Introduction with Applications
Statistics
ISBN:9781119256830
Author:Amos Gilat
Publisher:John Wiley & Sons Inc
Probability and Statistics for Engineering and th...
Statistics
ISBN:9781305251809
Author:Jay L. Devore
Publisher:Cengage Learning
Statistics for The Behavioral Sciences (MindTap C...
Statistics
ISBN:9781305504912
Author:Frederick J Gravetter, Larry B. Wallnau
Publisher:Cengage Learning
Elementary Statistics: Picturing the World (7th E...
Statistics
ISBN:9780134683416
Author:Ron Larson, Betsy Farber
Publisher:PEARSON
The Basic Practice of Statistics
Statistics
ISBN:9781319042578
Author:David S. Moore, William I. Notz, Michael A. Fligner
Publisher:W. H. Freeman
Introduction to the Practice of Statistics
Statistics
ISBN:9781319013387
Author:David S. Moore, George P. McCabe, Bruce A. Craig
Publisher:W. H. Freeman