MATLAB: An Introduction with Applications
6th Edition
ISBN: 9781119256830
Author: Amos Gilat
Publisher: John Wiley & Sons Inc
expand_more
expand_more
format_list_bulleted
Question

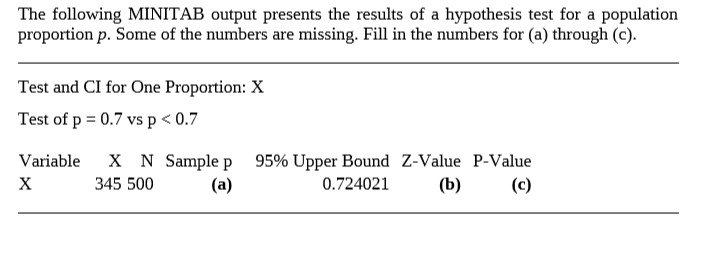
Transcribed Image Text:The following MINITAB output presents the results of a hypothesis test for a population
proportion p. Some of the numbers are missing. Fill in the numbers for (a) through (c).
Test and CI for One Proportion: X
Test of p = 0.7 vsp < 0.7
X N Sample p 95% Upper Bound z-Value P-Value
0.724021
Variable
345 500
(a)
(b)
(b)
(c)
х
Expert Solution
This question has been solved!
Explore an expertly crafted, step-by-step solution for a thorough understanding of key concepts.
This is a popular solution
Trending nowThis is a popular solution!
Step by stepSolved in 3 steps with 1 images

Knowledge Booster
Similar questions
- a) which for these data is 32.1470, 42.3520, or 10.0674 c) that minimizes the error sum of squares, total sum of squares, or regression sum of squares…for which these data is 32.1470, 42.3520, or 10.0674arrow_forwardOur environment is very sensitive to the amount of ozone in the upper atmosphere. The level of ozone normally found is 4.4 parts/million (ppm). A researcher believes that the current ozone level is not at the normal level. The mean of 1090 samples is 4.3 ppm. Assume the variance is known to be 1.44. Does the data support the claim at the 0.05 level? Step 1 of 5: Enter the hypotheses: Step 2 of 5: Enter the value of the z test statistic. Round your answer to two decimal places. Step 3 of 5: Specify if the test is one-tailed or two-tailed. Step 4 of 5: Enter the decision rule. Step 5 of 5: Enter the conclusion.arrow_forwarda. For this study, we should use t-test for a population mean b. The null and alternative hypotheses would be: Ho: uv (Please enter a decimal) c. The test statistic z v (please show your answer to 3 decimal places.) %3D d. The p-value = (Please show your answer to 4 decimal places.) %3D e. The p-value is> va f. Based on this, we should fail to reject vthe null hypothesis. g. Thus, the final conclusion is that ...arrow_forward
- A researcher would like to evaluate the effectiveness of a pain-relief patch designed for lower back pain. Prior to testing the patch, each of n = 8 patients rates the current level of back pain on a scale from 1 to 10. After wearing the patch for 90 minutes, a second pain rating is recorded. The data are as follows: Include in your responses: A. Compute the mean and variance for the sample of difference scores. B. Provide the Null and alternative hypotheses C. Calculate SSDarrow_forwardQ1-5: Given the following data from a sample of sizen= 7 12 7 49073 The third qoartile is: Select one: O a. 4 O b. 7 O c. 8 O d. 9arrow_forwardUse the following R output to answer the question. Use the following R output to answer the question. >chisq.test(data) Pearsons Chi-square test data:data X-squared=4.7194, df=2, p-value=0.09445 If the significance level is 5%, what conclusion can you make? Group of answer choices A. fail to reject the alternative hypothesis B. cannot determine C. fail to reject the null hypothesis D. reject the null hypothesis and accept the alternative hypothesisarrow_forward
- I need help finding the test statistic and the P-valuearrow_forwardA. 2.1arrow_forwardTwo samples of n = 5 participants each generate the following data. Calculate a t-test score for the difference of these two groups. Group 1 Group 2 2 3 3 3 2 2 2 2 1 2 t(8) = 2.86 t(8) = 2.29 t(8) = 2.5 t(8) = 1.11arrow_forward
arrow_back_ios
arrow_forward_ios
Recommended textbooks for you
 MATLAB: An Introduction with ApplicationsStatisticsISBN:9781119256830Author:Amos GilatPublisher:John Wiley & Sons Inc
 Probability and Statistics for Engineering and th...StatisticsISBN:9781305251809Author:Jay L. DevorePublisher:Cengage Learning
 Statistics for The Behavioral Sciences (MindTap C...StatisticsISBN:9781305504912Author:Frederick J Gravetter, Larry B. WallnauPublisher:Cengage Learning
 Elementary Statistics: Picturing the World (7th E...StatisticsISBN:9780134683416Author:Ron Larson, Betsy FarberPublisher:PEARSON
 The Basic Practice of StatisticsStatisticsISBN:9781319042578Author:David S. Moore, William I. Notz, Michael A. FlignerPublisher:W. H. Freeman
 Introduction to the Practice of StatisticsStatisticsISBN:9781319013387Author:David S. Moore, George P. McCabe, Bruce A. CraigPublisher:W. H. Freeman

MATLAB: An Introduction with Applications
Statistics
ISBN:9781119256830
Author:Amos Gilat
Publisher:John Wiley & Sons Inc

Probability and Statistics for Engineering and th...
Statistics
ISBN:9781305251809
Author:Jay L. Devore
Publisher:Cengage Learning

Statistics for The Behavioral Sciences (MindTap C...
Statistics
ISBN:9781305504912
Author:Frederick J Gravetter, Larry B. Wallnau
Publisher:Cengage Learning

Elementary Statistics: Picturing the World (7th E...
Statistics
ISBN:9780134683416
Author:Ron Larson, Betsy Farber
Publisher:PEARSON

The Basic Practice of Statistics
Statistics
ISBN:9781319042578
Author:David S. Moore, William I. Notz, Michael A. Fligner
Publisher:W. H. Freeman

Introduction to the Practice of Statistics
Statistics
ISBN:9781319013387
Author:David S. Moore, George P. McCabe, Bruce A. Craig
Publisher:W. H. Freeman