
MATLAB: An Introduction with Applications
6th Edition
ISBN: 9781119256830
Author: Amos Gilat
Publisher: John Wiley & Sons Inc
expand_more
expand_more
format_list_bulleted
Related questions
Question
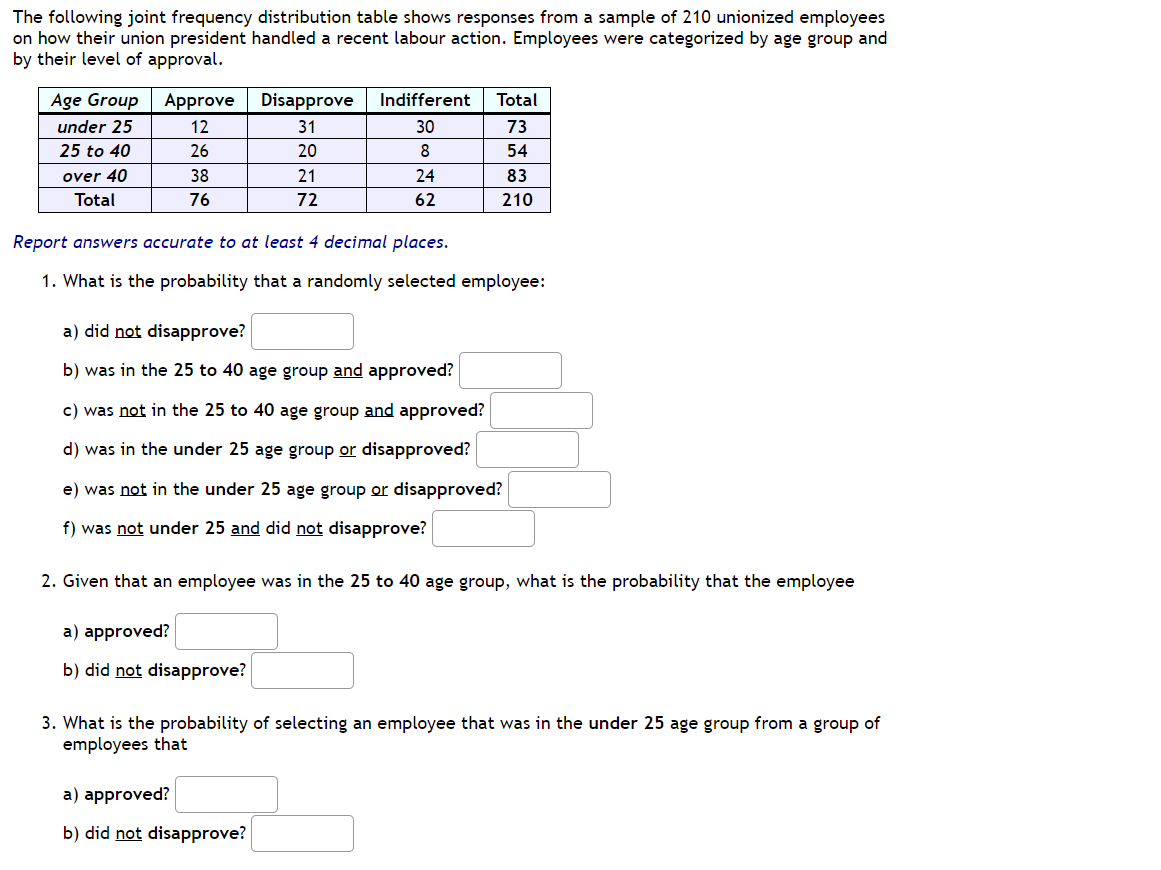
The following joint frequency distribution table shows responses from a sample of 210 unionized employees on how their union president handled a recent labour action. Employees were categorized by age group and by their level of approval.
| Age Group | Approve | Disapprove | Indifferent | Total |
|---|---|---|---|---|
| under 25 | 12 | 31 | 30 | 73 |
| 25 to 40 | 26 | 20 | 8 | 54 |
| over 40 | 38 | 21 | 24 | 83 |
| Total | 76 | 72 | 62 | 210 |
Report answers accurate to at least 4 decimal places.
- What is the probability that a randomly selected employee:
a) did not disapprove?
b) was in the 25 to 40 age group and approved?
c) was not in the 25 to 40 age group and approved?
d) was in the under 25 age group or disapproved?
e) was not in the under 25 age group or disapproved?
f) was not under 25 and did not disapprove?
- Given that an employee was in the 25 to 40 age group, what is the probability that the employee
a) approved?
b) did not disapprove?
- What is the probability of selecting an employee that was in the under 25 age group from a group of employees that
a) approved?
b) did not disapprove?

Transcribed Image Text:The following joint frequency distribution table shows responses from a sample of 210 unionized employees
on how their union president handled a recent labour action. Employees were categorized by age group and
by their level of approval.
Age Group
under 25
25 to 40
over 40
Total
Approve
12
26
38
76
Disapprove
31
20
21
72
Indifferent
30
8
24
62
a) approved?
b) did not disapprove?
Total
73
54
83
210
Report answers accurate to at least 4 decimal places.
1. What is the probability that a randomly selected employee:
a) did not disapprove?
b) was in the 25 to 40 age group and approved?
c) was not in the 25 to 40 age group and approved?
d) was in the under 25 age group or disapproved?
e) was not in the under 25 age group or disapproved?
f) was not under 25 and did not disapprove?
2. Given that an employee was in the 25 to 40 age group, what is the probability that the employee
a) approved?
b) did not disapprove?
3. What is the probability of selecting an employee that was in the under 25 age group from a group of
employees that
Expert Solution
This question has been solved!
Explore an expertly crafted, step-by-step solution for a thorough understanding of key concepts.

This is a popular solution

Trending nowThis is a popular solution!

Step by stepSolved in 5 steps with 6 images

Knowledge Booster

Similar questions
- (a) How many classes are there? There are classes. (b) What is the class width? The class width is X X Part 2 of 2 Do not round. (c) What percentage of students play video games for less than 19 hr per week? % of the students play video games for less than 19 hr per week. (d) What percentage of students play video games for 16 or more hours per week? % of the students play video games for 16 or more hours per week. X Sarrow_forwardA graduating class reported starting salaries represented on the following frequency table. Number of students Starting Salary ($) 10 15,000 17 20,000 25 25,000 38 30,000 27 35,000 21 40,000 12 45, 000 What is the mean?arrow_forward13) The table below describes the smoking habits of a group of asthma sufferers. Light Heavy Nonsmoker smoker smoker Total 39 Men 352 37 428 Women 321 42 45 408 Total 673 81 82 836 If two different people are randomly selected from the 836 subjects find the probability that they are bour h smokers. Round to six decimal places.arrow_forward
- The National Longitudinal Study of Adolescent Health interviewed several thousand teens (grades 7 to 12). One question asked was “What do you think are the chances you will be married in the next 10 years?” Here is a two-way table of the responses by gender: Opinion Female Male Almost no chance 138 114 Some chance but probably not 134 165 A 50-50 chance 467 512 A good chance 736 718 Almost certain 1187 746 How many individuals are described in this table? How many females were among the respondents? The percent of females among the respondents was about %. Your percent from the previous exercise is part of the marginal distribution of sex. the conditional distribution of sex among adolescents with a given opinion. the marginal distribution of opinion about marriage. What percent of females thought that they were almost certain to be married in the next 10 years?% Your percent from the previous exercise is part of the conditional distribution of sex among…arrow_forwardThe following table shows age distribution and location of a random sample of 166 buffalo in Yellowstone National Park. Suppose a Yellowstone buffalo is selected at random. Use the table to answer the following question. Age Lamar Nez Perce Firehole Total Calf 13 13 15 41 Yearling 10 11 12 33 Adult 34 28 30 92 Total 57 52 57 Total: 166 Find the probability that it is a calf given that it is from the Lamar district.arrow_forwardThe National Longitudinal Study of Adolescent Health interviewed several thousand teens (grades 7 to 12). One question asked was "What do you think are the chances you will be married in the next 10 years?" Here is a two-way table of the responses by gender: Opinion Female Male Almost no chance 139 86 Some chance but probably not 156 189 A 50-50 chance 441 517 A good chance 724 728 Almost certain 1176 769 a. How many individuals are described in this table? b. How many females were among the respondents? c. The percent of females among the respondents was about %.arrow_forward
- Refer to the sample data for pre-employment drug screening shown below. If one of the subjects is randomly selected, what is the probability that the test result is a false positive? Who Kwould suffer from a false positive result? Why? Pre-Employment Drug Screening Results Positive test result Drug Use Is Indicated 45 2 Subject Uses Drugs Subject is Not a Drug User The probability of a false positive test result is (Round to three decimal places as needed.) Who would suffer from a false positive result? Why? Negative test result D Drug Use Is Not Indicated 13 36 KUID + OA. The person tested would suffer because he or she would not be suspected of using drugs when in reality he or she does use drugs. OB. The employer would suffer because the person tested would not be suspected of using drugs when in reality he or she does use drugs. OC. The employer would suffer because the person tested would be suspected of using drugs when in reality he or she does not use drugs. OD. The person…arrow_forwardThe following table shows the percentage of on-time arrivals, the number of mishandled baggage reports per 1000 passengers, and the number of customer complaints per 1000 passengers for 10 airlines (Forbes website, February 2014). a. If you randomly choose a Delta Air Lines flight, what is the probability that this individual flight has an on-time arrival? b. lf you randomly choose one of the 10 airlines for a follow-up study on airline quality ratings, what is the probability that you will choose an airline with less than two mishandled baggage reports per 1000 passengers? c. If you randomly choose 1 of the 10 airlines for a follow-up study on airline quality ratings, what is the probability that you will choose an airline with more than one customer complaint per 1000 passengers? d. What is the probability that a randomly selected AirTran Airways flight will not arrive on time?arrow_forwardThe table below summarizes the results from a 1988 study of accident records conducted by the Florida Department of Highway Safety. Assuming that this sample is representative, answer the following probability questions. Nonfatal Injury Fatal Injury Total Seat Belt 412,368 510 412,878 No Seat Belt 162,527 1,601 164,128 Total 574,895 2,111 577,006 What is the probability that a randomly selected accident has both a nonfatal injury and the driver wore a seat belt? What is the probability that a randomly selected accident has a fatal injury or the driver did not wear a seat belt?arrow_forward
- 6. The figure below is a contingency table showing the counts of earned degrees from several colleges. The level of degree and gender of the degree recipient were tracked use this table to answer the following questions: Bachelor's Master's Professional Doctorate Total Female 542 128 26 18 714 Male 438 165 38 20 661 Total 980 293 64 38 1375 (a) What is the probability that a randomly chosen person received a Bachelor's Degree? (b) What is the probability that a randomly chosen person received a Master's Degree given that they are Female-- P(Masters Female)? O EXTD D 10:17arrow_forward2. A set of Midterm examination grades in an introductory statistics course is normally distributed, as following: Name Grade Name Grade Hakim 60 Hadi 80 Joko 70 Ilham 60 Budi 60 Ana 80 Ani 80 Aji 70 Anisa 90 Siti 80 a. Calculate mean and standard deviation b. What is the probability that a student scored below 90 on this exam? C. What is the probability that a student scored between 70 and 80? d. The probability is 20% that a student taking the test scores higher than what grade?arrow_forwardUsing the Two-Way Table provided below answer the following question: Men Women Boys Girls TOTAL Survived 332 318 29 27 706 Died 1360 104 35 18 1517 TOTAL Question 9 What is the probability of randomly selecting back to back people and they are a Male Who Survived and a Girl who died?arrow_forward
arrow_back_ios
SEE MORE QUESTIONS
arrow_forward_ios
Recommended textbooks for you
- MATLAB: An Introduction with ApplicationsStatisticsISBN:9781119256830Author:Amos GilatPublisher:John Wiley & Sons Inc
 Probability and Statistics for Engineering and th...StatisticsISBN:9781305251809Author:Jay L. DevorePublisher:Cengage Learning
 Statistics for The Behavioral Sciences (MindTap C...StatisticsISBN:9781305504912Author:Frederick J Gravetter, Larry B. WallnauPublisher:Cengage Learning
  Elementary Statistics: Picturing the World (7th E...StatisticsISBN:9780134683416Author:Ron Larson, Betsy FarberPublisher:PEARSON
 The Basic Practice of StatisticsStatisticsISBN:9781319042578Author:David S. Moore, William I. Notz, Michael A. FlignerPublisher:W. H. Freeman
 Introduction to the Practice of StatisticsStatisticsISBN:9781319013387Author:David S. Moore, George P. McCabe, Bruce A. CraigPublisher:W. H. Freeman
MATLAB: An Introduction with Applications
Statistics
ISBN:9781119256830
Author:Amos Gilat
Publisher:John Wiley & Sons Inc
Probability and Statistics for Engineering and th...
Statistics
ISBN:9781305251809
Author:Jay L. Devore
Publisher:Cengage Learning
Statistics for The Behavioral Sciences (MindTap C...
Statistics
ISBN:9781305504912
Author:Frederick J Gravetter, Larry B. Wallnau
Publisher:Cengage Learning
Elementary Statistics: Picturing the World (7th E...
Statistics
ISBN:9780134683416
Author:Ron Larson, Betsy Farber
Publisher:PEARSON
The Basic Practice of Statistics
Statistics
ISBN:9781319042578
Author:David S. Moore, William I. Notz, Michael A. Fligner
Publisher:W. H. Freeman
Introduction to the Practice of Statistics
Statistics
ISBN:9781319013387
Author:David S. Moore, George P. McCabe, Bruce A. Craig
Publisher:W. H. Freeman