MATLAB: An Introduction with Applications
6th Edition
ISBN: 9781119256830
Author: Amos Gilat
Publisher: John Wiley & Sons Inc
expand_more
expand_more
format_list_bulleted
Question

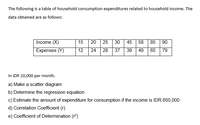
Transcribed Image Text:The following is a table of household consumption expenditures related to household income. The
data obtained are as follows:
Income (X)
Expenses (Y)
15
20
25 30
45 58
85 90
12
24
28
37
39
49
65
79
In IDR 10,000 per month.
a) Make a scatter diagram
b) Determine the regression equation
c) Estimate the amount of expenditure for consumption if the income is IDR 650,000
d) Correlation Coefficient (r)
e) Coefficient of Determination (r)
Expert Solution
This question has been solved!
Explore an expertly crafted, step-by-step solution for a thorough understanding of key concepts.
Step by stepSolved in 5 steps with 3 images

Knowledge Booster
Similar questions
- The datasetBody.xlsgives the percent of weight made up of body fat for 100 men as well as other variables such as Age, Weight (lb), Height (in), and circumference (cm) measurements for the Neck, Chest, Abdomen, Ankle, Biceps, and Wrist. We are interested in predicting body fat based on abdomen circumference. Find the equation of the regression line relating to body fat and abdomen circumference. Make a scatter-plot with a regression line. What body fat percent does the line predict for a person with an abdomen circumference of 110 cm? One of the men in the study had an abdomen circumference of 92.4 cm and a body fat of 22.5 percent. Find the residual that corresponds to this observation. Bodyfat Abdomen 32.3 115.6 22.5 92.4 22 86 12.3 85.2 20.5 95.6 22.6 100 28.7 103.1 21.3 89.6 29.9 110.3 21.3 100.5 29.9 100.5 20.4 98.9 16.9 90.3 14.7 83.3 10.8 73.7 26.7 94.9 11.3 86.7 18.1 87.5 8.8 82.8 11.8 83.3 11 83.6 14.9 87 31.9 108.5 17.3…arrow_forwardThe table shows the national expenditures for health care in billions, in a country for the selected years from 1990 to 2020. Given the projection cost for the year 2002, identify the type of regression point. Year Exprenditures ($billions) 1991 1020 1994 1356 1998 1984 2004 2984 2009 3374 2016 4765 2020 5937 Interpolation Extrapolation Neither Botharrow_forwardI need help answering parts D, E and F.arrow_forward
- The invasive diatom species Didymosphenia geminata has the potential to inflict substantial ecological and economic damage in rivers. An article described an investigation of colonization behavior. One aspect of particular interest was whether y = colony density was related to x = rock surface area. The article contained a scatterplot and summary of a regression analysis. Here is representative data. x 50 71 55 50 33 58 79 26 y 157 1934 53 27 7 10 40 12 x 69 44 37 70 20 45 49 y 274 43 176 18 48 190 30 (a) Fit the simple linear regression model to this data. (Round your numerical values to three decimal places.) y = Predict colony density when surface area = 70 and calculate the corresponding residual. (Round your answers to the nearest whole number.) colony density corresponding residual Predict colony density when surface area = 71 and calculate the corresponding residual. (Round your answers to the nearest whole number.) colony…arrow_forwardListed below are paired data consisting of movie budget amounts and the amounts that the movies grossed. Find the regression equation, letting the budget be the predictor (x) variable. Find the best predicted amount that a movie will gross if its budget is $140 million. Use a significance level of a = 0.05. Budget ($)in Millions Gross ($) in Millions 39 22 118 67 77 49 124 66 12 64 128 19 6. 147 9. 118 6. 99 75 127 107 95 99 64 109 209 44 8 293 48 Click the icon to view the critical values of the Pearson correlation coefficient r. The regression equation is y =+x. (Round to one decimal place as needed.)arrow_forwardThe following table contains ACT scores and the GPA for eight college students. Estimate the relationship between GPA (yi) and ACT (x;) using OLS regression by hand. Report the intercept and slope estimates: Student 1 2 3 4 5 6 7 8 GPA 2.8 3.4 3.0 3.5 3.6 3.0 2.7 3.7 ŷ₁ =B₁ + B₁x₁ ACT 21 24 26 27 29 25 25 30 y X ŷ₁arrow_forward
arrow_back_ios
arrow_forward_ios
Recommended textbooks for you
 MATLAB: An Introduction with ApplicationsStatisticsISBN:9781119256830Author:Amos GilatPublisher:John Wiley & Sons Inc
 Probability and Statistics for Engineering and th...StatisticsISBN:9781305251809Author:Jay L. DevorePublisher:Cengage Learning
 Statistics for The Behavioral Sciences (MindTap C...StatisticsISBN:9781305504912Author:Frederick J Gravetter, Larry B. WallnauPublisher:Cengage Learning
 Elementary Statistics: Picturing the World (7th E...StatisticsISBN:9780134683416Author:Ron Larson, Betsy FarberPublisher:PEARSON
 The Basic Practice of StatisticsStatisticsISBN:9781319042578Author:David S. Moore, William I. Notz, Michael A. FlignerPublisher:W. H. Freeman
 Introduction to the Practice of StatisticsStatisticsISBN:9781319013387Author:David S. Moore, George P. McCabe, Bruce A. CraigPublisher:W. H. Freeman

MATLAB: An Introduction with Applications
Statistics
ISBN:9781119256830
Author:Amos Gilat
Publisher:John Wiley & Sons Inc

Probability and Statistics for Engineering and th...
Statistics
ISBN:9781305251809
Author:Jay L. Devore
Publisher:Cengage Learning

Statistics for The Behavioral Sciences (MindTap C...
Statistics
ISBN:9781305504912
Author:Frederick J Gravetter, Larry B. Wallnau
Publisher:Cengage Learning

Elementary Statistics: Picturing the World (7th E...
Statistics
ISBN:9780134683416
Author:Ron Larson, Betsy Farber
Publisher:PEARSON

The Basic Practice of Statistics
Statistics
ISBN:9781319042578
Author:David S. Moore, William I. Notz, Michael A. Fligner
Publisher:W. H. Freeman

Introduction to the Practice of Statistics
Statistics
ISBN:9781319013387
Author:David S. Moore, George P. McCabe, Bruce A. Craig
Publisher:W. H. Freeman