MATLAB: An Introduction with Applications
6th Edition
ISBN: 9781119256830
Author: Amos Gilat
Publisher: John Wiley & Sons Inc
expand_more
expand_more
format_list_bulleted
Question

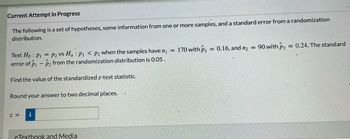
Transcribed Image Text:Current Attempt in Progress
The following is a set of hypotheses, some information from one or more samples, and a standard error from a randomization
distribution.
Test Ho: P1 P2 Vs Ha: P1 P2 when the samples have n₁ =
error of P1 - ₂ from the randomization distribution is 0.05.
Find the value of the standardized z-test statistic.
Round your answer to two decimal places.
Z = i
eTextbook and Media
170 with P₁
=
0.16, and n₂
=
90 with P₂
= 0.24. The standard
Expert Solution
This question has been solved!
Explore an expertly crafted, step-by-step solution for a thorough understanding of key concepts.
Step by stepSolved in 3 steps with 9 images

Knowledge Booster
Similar questions
- 43. Independent random samples are selected from two populations. Below are selected summary statistics. Рop. Mean 73.00 Stand. Dev. Sample size 1 10.00 14 2 62.50 6.00 8 (a) Construct the 95% confidence interval for их — рү. (b) Obtain the P-value for the alternativearrow_forwardThe following is a set of hypotheses, some information from one or more samples, and a standard error from a randomization distribution. Test Ho P = .29 vs. Ha P<.29 when the sample has n3800 and p =.229 with SE -.01 The value of the standardized z test statistic is [zteststatitic]. round to nearest.01arrow_forwardIn a left-tailed hypothesis for a population mean where the population standard deviation is unknown, the test statistic for a random sample size 18 was calculated to be -4.0545. Determine the P-value for the test. Xarrow_forward
- 1. In your own words, what happens to the F-statistic if two variances are different? 2. If the F-statistic is close to one, what would be the decision of a hypothesis test? 3. What is the value of the F-statistic if one sample has a standard deviation of 0.00436 and another sample has a standard deviation of 0.0057?arrow_forwardSuppose that average rainfall in your city is normally distributed, and for the past 36 months, the rainfall has been 0.5 inches per day on average with a standard deviation of 0.16. Let x be a random variable that has a normal distribution and represents the rainfall in inches per day. Using a 0.05 level of significance, you want to test the hypothesis that monthly rainfall has been 0.7 inches per day on average. What conclusion do you make from your test? Select one: a. Reject H0; the average rainfall is not 0.5 inches. b. Reject H0; the average rainfall is not 0.7 inches. c. Do not reject H0; the average rainfall is still 0.5 inches. d. Do not reject H0; the average rainfall is still 0.7 inches.arrow_forwardThese are the summary statistics for independent simple random samples from two populations. x1=23, s1=2, n1=10, x2=29, s2=7, n2=25 Left tailed test, significance level is 0.05 or 95% What is the test statistic, critical value, and conclusion for the hypothesis test?arrow_forward
- Suppose a researcher pbserves a population of 12 people and computes SS=204. What is the variance? What is the standard deviation?arrow_forwardBIG Corporation advertises that its light bulbs have a mean lifetime, u, of 3000 hours. Suppose that we have reason to doubt this claim and decide to do a statistical test of the claim. We choose a random sample of light bulbs manufactured by BIG and find that the mean lifetime for this sample is 3160 hours and that the sample standard deviation of the lifetimes is 600 hours. Based on this information, answer the questions below. What are the null hypothesis (H.) and the alternative hypothesis (H,) that should be used for the test? Ho: u is ? H: u is ? In the context of this test, what is a Type I error? A Type I error is ? v the hypothesis that u is? when, in fact, u is ? Suppose that we decide to reject the null hypothesis. What sort of error might we be making? ?arrow_forward
arrow_back_ios
arrow_forward_ios
Recommended textbooks for you
 MATLAB: An Introduction with ApplicationsStatisticsISBN:9781119256830Author:Amos GilatPublisher:John Wiley & Sons Inc
 Probability and Statistics for Engineering and th...StatisticsISBN:9781305251809Author:Jay L. DevorePublisher:Cengage Learning
 Statistics for The Behavioral Sciences (MindTap C...StatisticsISBN:9781305504912Author:Frederick J Gravetter, Larry B. WallnauPublisher:Cengage Learning
 Elementary Statistics: Picturing the World (7th E...StatisticsISBN:9780134683416Author:Ron Larson, Betsy FarberPublisher:PEARSON
 The Basic Practice of StatisticsStatisticsISBN:9781319042578Author:David S. Moore, William I. Notz, Michael A. FlignerPublisher:W. H. Freeman
 Introduction to the Practice of StatisticsStatisticsISBN:9781319013387Author:David S. Moore, George P. McCabe, Bruce A. CraigPublisher:W. H. Freeman

MATLAB: An Introduction with Applications
Statistics
ISBN:9781119256830
Author:Amos Gilat
Publisher:John Wiley & Sons Inc

Probability and Statistics for Engineering and th...
Statistics
ISBN:9781305251809
Author:Jay L. Devore
Publisher:Cengage Learning

Statistics for The Behavioral Sciences (MindTap C...
Statistics
ISBN:9781305504912
Author:Frederick J Gravetter, Larry B. Wallnau
Publisher:Cengage Learning

Elementary Statistics: Picturing the World (7th E...
Statistics
ISBN:9780134683416
Author:Ron Larson, Betsy Farber
Publisher:PEARSON

The Basic Practice of Statistics
Statistics
ISBN:9781319042578
Author:David S. Moore, William I. Notz, Michael A. Fligner
Publisher:W. H. Freeman

Introduction to the Practice of Statistics
Statistics
ISBN:9781319013387
Author:David S. Moore, George P. McCabe, Bruce A. Craig
Publisher:W. H. Freeman