
ENGR.ECONOMIC ANALYSIS
14th Edition
ISBN: 9780190931919
Author: NEWNAN
Publisher: Oxford University Press
expand_more
expand_more
format_list_bulleted
Related questions
Question
Econ question
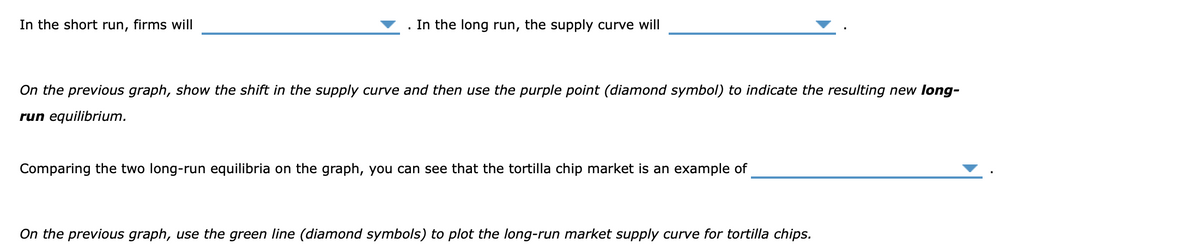

Transcribed Image Text:In the short run, firms will
. In the long run, the supply curve will
On the previous graph, show the shift in the supply curve and then use the purple point (diamond symbol) to indicate the resulting new long-
run equilibrium.
Comparing the two long-run equilibria on the graph, you can see that the tortilla chip market is an example of
On the previous graph, use the green line (diamond symbols) to plot the long-run market supply curve for tortilla chips.

Transcribed Image Text:The following graph shows the market for tortilla chip. Initially, the market is in a long-run equilibrium.
Suppose that a change in tastes resulted in a leftward shift in demand.
On the following graph, shift the demand or supply curve to reflect this change in tastes. Then use the grey point (star symbol) to indicate the new
short-run equilibrium.
Note: Select and drag one or both of the curves to the desired position. Curves will snap into position, so if you try to move a curve and it snaps back
to its original position, just drag it a little farther.
(?
10
Short-run Supply
Demand
Short-run Supply
4
Short-run Equilibrium
Demand
2
Long-run Equilibrium
2
4
6
10
Long-run Supply
QUANTITY (Thousands of bags)
PRICE (Dollars per bag)
Expert Solution
This question has been solved!
Explore an expertly crafted, step-by-step solution for a thorough understanding of key concepts.

This is a popular solution

Trending nowThis is a popular solution!

Step by stepSolved in 2 steps with 2 images

Knowledge Booster


Learn more about
Need a deep-dive on the concept behind this application? Look no further. Learn more about this topic, economics and related others by exploring similar questions and additional content below.Similar questions
- The GDP deflator in year 2 is a b Question 27 с Selected answer will be automatically saved. For keyboard navigation, press up/down arrow keys to select an answer. d 177.2 125.7 95.4 Prod Car 105.8 Cen Dene Quarnity (1 M 30 100 (1) 30 S Quarter (2) 100 15 150 25 P 30 30arrow_forwardHelp in less than 10 minutesarrow_forwardWhat is a leading economic indicator? Provide two examples.arrow_forward
- how do i graph?arrow_forwardEcon 2301 (Consumer Prices)When prices rise, there may be some ability to minimize the impact of higher prices, if you can substitute a less expensive alternative. Is this always possible?arrow_forwardSuppose that the policy-makers of a foreign country decide to enact policy that reduces unemployment (at the expense of higher prices) just before an election. At the time of the election, however, the reduction in unemployment is much greater than expected, and the pesky inflation increase never occurs. The graph illustrates the economy before the government attempts to reduce unemployment. Change the graph to illustrate changes in the economy that could result in lower unemployment without an increase in prices. Note that LRAS represents long-run aggregate supply, SRAS represents short-run aggregate supply, and AD represents aggregate demand. evel LRAS SRASarrow_forward
arrow_back_ios
arrow_forward_ios
Recommended textbooks for you
 Principles of Economics (12th Edition)EconomicsISBN:9780134078779Author:Karl E. Case, Ray C. Fair, Sharon E. OsterPublisher:PEARSON
 Engineering Economy (17th Edition)EconomicsISBN:9780134870069Author:William G. Sullivan, Elin M. Wicks, C. Patrick KoellingPublisher:PEARSON
 Principles of Economics (MindTap Course List)EconomicsISBN:9781305585126Author:N. Gregory MankiwPublisher:Cengage Learning
 Managerial Economics: A Problem Solving ApproachEconomicsISBN:9781337106665Author:Luke M. Froeb, Brian T. McCann, Michael R. Ward, Mike ShorPublisher:Cengage Learning
 Managerial Economics & Business Strategy (Mcgraw-...EconomicsISBN:9781259290619Author:Michael Baye, Jeff PrincePublisher:McGraw-Hill Education
Principles of Economics (12th Edition)
Economics
ISBN:9780134078779
Author:Karl E. Case, Ray C. Fair, Sharon E. Oster
Publisher:PEARSON
Engineering Economy (17th Edition)
Economics
ISBN:9780134870069
Author:William G. Sullivan, Elin M. Wicks, C. Patrick Koelling
Publisher:PEARSON
Principles of Economics (MindTap Course List)
Economics
ISBN:9781305585126
Author:N. Gregory Mankiw
Publisher:Cengage Learning
Managerial Economics: A Problem Solving Approach
Economics
ISBN:9781337106665
Author:Luke M. Froeb, Brian T. McCann, Michael R. Ward, Mike Shor
Publisher:Cengage Learning
Managerial Economics & Business Strategy (Mcgraw-...
Economics
ISBN:9781259290619
Author:Michael Baye, Jeff Prince
Publisher:McGraw-Hill Education