
Advanced Engineering Mathematics
10th Edition
ISBN: 9780470458365
Author: Erwin Kreyszig
Publisher: Wiley, John & Sons, Incorporated
expand_more
expand_more
format_list_bulleted
Related questions
Question
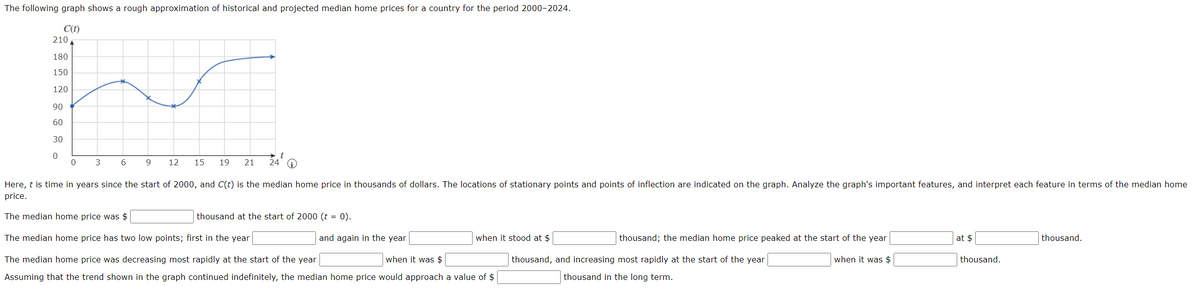

Transcribed Image Text:The following graph shows a rough approximation of historical and projected median home prices for a country for the period 2000-2024.
C(t)
210 A
180
150
120
90
60
30
0
12 15 19 21 24 i
Here, t is time in years since the start of 2000, and C(t) is the median home price in thousands of dollars. The locations of stationary points and points of inflection are indicated on the graph. Analyze the graph's important features, and interpret each feature in terms of the median home
price.
The median home price was $
The median home price has two low points; first in the year
and again in the year
The median home price was decreasing most rapidly at the start of the year
when it was $
Assuming that the trend shown in the graph continued indefinitely, the median home price would approach a value of $
0
3
6
9
thousand at the start of 2000 (t = 0).
when it stood at $
thousand; the median home price peaked at the start of the year
when it was $
thousand, and increasing most rapidly at the start of the year
thousand in the long term.
at $
thousand.
thousand.
Expert Solution
This question has been solved!
Explore an expertly crafted, step-by-step solution for a thorough understanding of key concepts.

This is a popular solution

Trending nowThis is a popular solution!

Step by stepSolved in 2 steps

Knowledge Booster

Similar questions
- The following graph shows a rough approximation of historical and projected median home prices for a country for the period 2000-2024. (Fill in blanks)arrow_forwardThe consumption function captures one of the key relationships in economics. It expresses consumption as a function of disposal income, where disposable income is income after taxes. The attached file “Quiz_dataset2” shows data of average US annual consumption (in $) and disposable income (in $) for the years 2000 to 2016. What is the predicted consumption if the disposable income is $30,000? Select one: a. 2365.7 b. None of the above c. 32645.9 d. 2365.6arrow_forward
arrow_back_ios
arrow_forward_ios
Recommended textbooks for you
- Advanced Engineering MathematicsAdvanced MathISBN:9780470458365Author:Erwin KreyszigPublisher:Wiley, John & Sons, Incorporated
 Numerical Methods for EngineersAdvanced MathISBN:9780073397924Author:Steven C. Chapra Dr., Raymond P. CanalePublisher:McGraw-Hill Education
 Introductory Mathematics for Engineering Applicat...Advanced MathISBN:9781118141809Author:Nathan KlingbeilPublisher:WILEY
  Mathematics For Machine TechnologyAdvanced MathISBN:9781337798310Author:Peterson, John.Publisher:Cengage Learning,

Advanced Engineering Mathematics
Advanced Math
ISBN:9780470458365
Author:Erwin Kreyszig
Publisher:Wiley, John & Sons, Incorporated
Numerical Methods for Engineers
Advanced Math
ISBN:9780073397924
Author:Steven C. Chapra Dr., Raymond P. Canale
Publisher:McGraw-Hill Education
Introductory Mathematics for Engineering Applicat...
Advanced Math
ISBN:9781118141809
Author:Nathan Klingbeil
Publisher:WILEY
Mathematics For Machine Technology
Advanced Math
ISBN:9781337798310
Author:Peterson, John.
Publisher:Cengage Learning,