MATLAB: An Introduction with Applications
6th Edition
ISBN: 9781119256830
Author: Amos Gilat
Publisher: John Wiley & Sons Inc
expand_more
expand_more
format_list_bulleted
Question

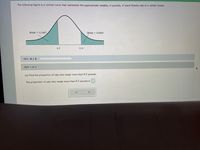
Transcribed Image Text:The following figure is a normal curve that represents the approximate weights, in pounds, of adult female cats of a certain breed.
Area = 0.3487
Area = 0.0569
8,5
11.0
Part: 0 / 3
Part 1 of 3
(a) Find the proportion of cats who weigh more than 8.5 pounds.
The proportion of cats who weigh more than 8.5 pounds is
Expert Solution
This question has been solved!
Explore an expertly crafted, step-by-step solution for a thorough understanding of key concepts.
This is a popular solution
Trending nowThis is a popular solution!
Step by stepSolved in 2 steps with 2 images

Knowledge Booster
Similar questions
- Find the area of the shaded region. The graph depicts the standard normal distribution of bone density scores with mean 0 and standard deviation 1. The area of the shaded region is. (Round to four decimal places as needed.) C z= -0.97 z=1.26 Garrow_forwardFind the area of the shaded region. The graph depicts the standard normal distribution of bone density scores with mean 0 and standard deviation 1. The area of the shaded region is (Round to four decimal places as needed.) z = -0.94 z=1.21arrow_forwardThe blood pressure in millimeters was measured for a large sample of people. The average pressure is 140 mm, and the SD of the measurements is 20 mm. The histogram looks reasonably like a normal curv Use the normal curve to estimate the following percentages. Choose the answer that is closest to being correct. A 19.1% B 30.9% C 38.2% D 69.1% E 68.27% A The percentage of people with blood pressure between 130 and 150 mm. B The percentage of people with blood pressure between 140 and 150 mm. D The percentage of people with blood pressure over 150 mm.arrow_forward
- Find the area of the shaded region. The graph depicts the standard normal distribution of bone density scores with mean 0 and standard deviation 1.arrow_forwardSystolic coefficients of variation are 14.2% and the Diastolic is 17% The coefficients of variation for each data set are: a. more than 5 percentage points apart b. within 5 percentage points of each other Therefore, the systolic measurements vary a. about the same as b. significantly more than c. significantly less than the diastolic measurements.arrow_forwardaChen -. M Gmail YouTube Maps oscar - Google D... Translate New Tab ece Gler 2/6 100% SID: 2. A researcher is studying the relationship between various properties of wine and their taste characteristics. The histogram below shows the amount of residual sugar (sugar left after fermentation) in a collection of wines. However, one of the bars, between 3 and 5 grams per liter, is missing. 50 (47.9) (38.7) 30 10 (0.1) (0.92) (0.1) 2 10 15 Residual sugar (grams/liter) Calculate the height of the missing bar and draw it in. (Show your work below, and indicate the numerical value in parentheses above the bar.) % per gramlterarrow_forward
- The percentage of scores falling below a z-score of .65arrow_forwardPlease see attached image. I need to calculate a weighted moving average where the weights should be 0.2, 0.3, and 0.5.arrow_forwardFind the area of the shaded region. The graph depicts the standard normal distribution of bone density scores with mean 0 and standard deviation 1. Z = -0.92 z=1.29 The area of the shaded region is (Round to four decimal places as needed.) ☑arrow_forward
- Find the area in a t-distribution below -2.3 if the sample has size n=8.Round your answer to three decimal places.area =arrow_forwardThe trunk diameter, in centimeters, of a certain variety of pine tree is represented by X~N(150, 30). What is the 75th percentile of trunk diameters? Round to two decimal places.arrow_forwardA random sample of 150 individuals (males and females) was surveyed, and the individuals were asked to indicate their year incomes. The results of the survey are shown below. Income Category Category 1: $20,000 up to $40,000 Category 2: $40,000 up to $60,000 Category 3: $60,000 up to $80,000 Edit Format Table Test at a = .05 to determine if the yearly income is independent of the gender. (CSLO 1,6,7) 12pt Male 10 35 15 V Paragraph BI U A Female 30 15 45 > 2 T² :arrow_forward
arrow_back_ios
arrow_forward_ios
Recommended textbooks for you
 MATLAB: An Introduction with ApplicationsStatisticsISBN:9781119256830Author:Amos GilatPublisher:John Wiley & Sons Inc
 Probability and Statistics for Engineering and th...StatisticsISBN:9781305251809Author:Jay L. DevorePublisher:Cengage Learning
 Statistics for The Behavioral Sciences (MindTap C...StatisticsISBN:9781305504912Author:Frederick J Gravetter, Larry B. WallnauPublisher:Cengage Learning
 Elementary Statistics: Picturing the World (7th E...StatisticsISBN:9780134683416Author:Ron Larson, Betsy FarberPublisher:PEARSON
 The Basic Practice of StatisticsStatisticsISBN:9781319042578Author:David S. Moore, William I. Notz, Michael A. FlignerPublisher:W. H. Freeman
 Introduction to the Practice of StatisticsStatisticsISBN:9781319013387Author:David S. Moore, George P. McCabe, Bruce A. CraigPublisher:W. H. Freeman

MATLAB: An Introduction with Applications
Statistics
ISBN:9781119256830
Author:Amos Gilat
Publisher:John Wiley & Sons Inc

Probability and Statistics for Engineering and th...
Statistics
ISBN:9781305251809
Author:Jay L. Devore
Publisher:Cengage Learning

Statistics for The Behavioral Sciences (MindTap C...
Statistics
ISBN:9781305504912
Author:Frederick J Gravetter, Larry B. Wallnau
Publisher:Cengage Learning

Elementary Statistics: Picturing the World (7th E...
Statistics
ISBN:9780134683416
Author:Ron Larson, Betsy Farber
Publisher:PEARSON

The Basic Practice of Statistics
Statistics
ISBN:9781319042578
Author:David S. Moore, William I. Notz, Michael A. Fligner
Publisher:W. H. Freeman

Introduction to the Practice of Statistics
Statistics
ISBN:9781319013387
Author:David S. Moore, George P. McCabe, Bruce A. Craig
Publisher:W. H. Freeman