
MATLAB: An Introduction with Applications
6th Edition
ISBN: 9781119256830
Author: Amos Gilat
Publisher: John Wiley & Sons Inc
expand_more
expand_more
format_list_bulleted
Related questions
Question
V1

Transcribed Image Text:Series Name: Value
DATE_
Q1 2010
Q2 2010
Q3 2010
Q4 2010
Q1 2011
Q2 2011
Original
Series
192.308
153.846
115.385
223.077
215.385
161.538
Moving
Average
Series
171.1538
176.9231
178.8462
182.6923
Seasonal Decomposition
Difference of
Original
Series from
Moving
Average
Series
-55.76923
46.15385
36.53846
-21.15385
Seasonal
Factor
31.45032
-22.39583
A
49.39904
31.45032
-22.39583
Seasonally Smoothed
Adjusted
Trend-Cycle
Series
Series
160.857
176.242
173.838
B
183.934
183.934
168.461
170.313
174.016
177.417
181.121
185.394
Irregular
(Error)
Component
-7.60328
5.92949
-.17806
-3.73932
2.81339
-1.46011

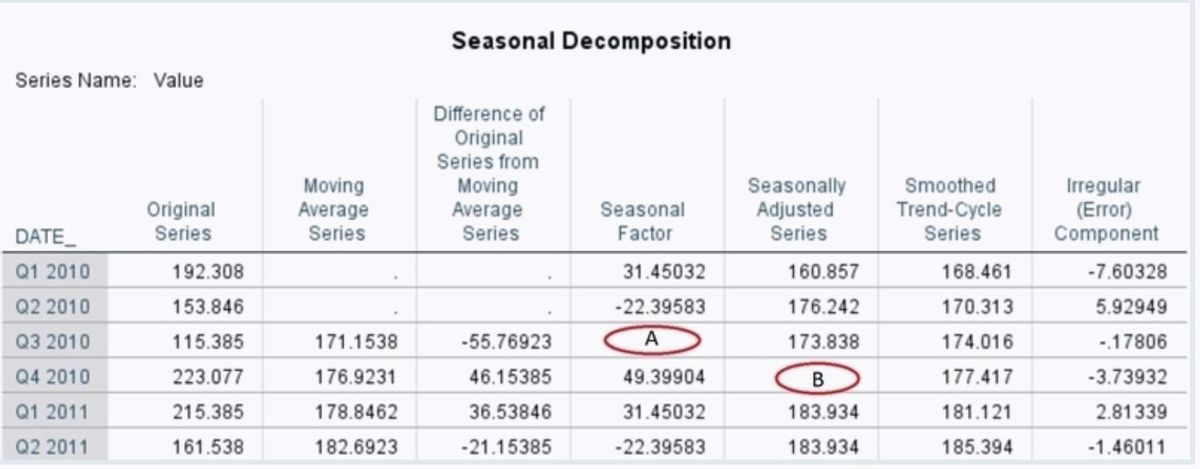
Transcribed Image Text:The following figure depicts a screenshot of
a seasonal decomposition result (additive
model) produced with SPSS. Use this figure
to answer questions 1
1. What is the value of A? (Round your
answer to two decimal places.)
What is the value of B? (Round your answer
to two decimal places.)
Expert Solution
This question has been solved!
Explore an expertly crafted, step-by-step solution for a thorough understanding of key concepts.

Step by stepSolved in 3 steps

Knowledge Booster

Similar questions
Recommended textbooks for you
- MATLAB: An Introduction with ApplicationsStatisticsISBN:9781119256830Author:Amos GilatPublisher:John Wiley & Sons Inc
 Probability and Statistics for Engineering and th...StatisticsISBN:9781305251809Author:Jay L. DevorePublisher:Cengage Learning
 Statistics for The Behavioral Sciences (MindTap C...StatisticsISBN:9781305504912Author:Frederick J Gravetter, Larry B. WallnauPublisher:Cengage Learning
  Elementary Statistics: Picturing the World (7th E...StatisticsISBN:9780134683416Author:Ron Larson, Betsy FarberPublisher:PEARSON
 The Basic Practice of StatisticsStatisticsISBN:9781319042578Author:David S. Moore, William I. Notz, Michael A. FlignerPublisher:W. H. Freeman
 Introduction to the Practice of StatisticsStatisticsISBN:9781319013387Author:David S. Moore, George P. McCabe, Bruce A. CraigPublisher:W. H. Freeman
MATLAB: An Introduction with Applications
Statistics
ISBN:9781119256830
Author:Amos Gilat
Publisher:John Wiley & Sons Inc
Probability and Statistics for Engineering and th...
Statistics
ISBN:9781305251809
Author:Jay L. Devore
Publisher:Cengage Learning
Statistics for The Behavioral Sciences (MindTap C...
Statistics
ISBN:9781305504912
Author:Frederick J Gravetter, Larry B. Wallnau
Publisher:Cengage Learning
Elementary Statistics: Picturing the World (7th E...
Statistics
ISBN:9780134683416
Author:Ron Larson, Betsy Farber
Publisher:PEARSON
The Basic Practice of Statistics
Statistics
ISBN:9781319042578
Author:David S. Moore, William I. Notz, Michael A. Fligner
Publisher:W. H. Freeman
Introduction to the Practice of Statistics
Statistics
ISBN:9781319013387
Author:David S. Moore, George P. McCabe, Bruce A. Craig
Publisher:W. H. Freeman