
Advanced Engineering Mathematics
10th Edition
ISBN: 9780470458365
Author: Erwin Kreyszig
Publisher: Wiley, John & Sons, Incorporated
expand_more
expand_more
format_list_bulleted
Related questions
Question
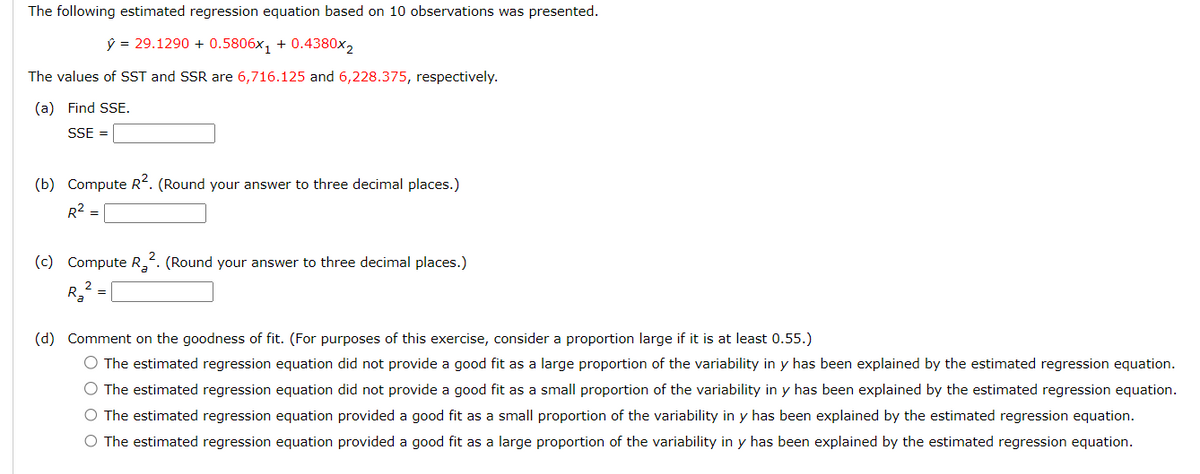

Transcribed Image Text:The following estimated regression equation based on 10 observations was presented.
ŷ 29.1290 + 0.5806x1 +0.4380x2
The values of SST and SSR are 6,716.125 and 6,228.375, respectively.
(a) Find SSE.
SSE =
(b) Compute R². (Round your answer to three decimal places.)
R²
2.
(c) Compute R₂². (Round your answer to three decimal places.)
Ra
(d) Comment on the goodness of fit. (For purposes of this exercise, consider a proportion large if it is at least 0.55.)
○ The estimated regression equation did not provide a good fit as a large proportion of the variability in y has been explained by the estimated regression equation.
○ The estimated regression equation did not provide a good fit as a small proportion of the variability in y has been explained by the estimated regression equation.
○ The estimated regression equation provided a good fit as a small proportion of the variability in y has been explained by the estimated regression equation.
○ The estimated regression equation provided a good fit as a large proportion of the variability in y has been explained by the estimated regression equation.
Expert Solution
This question has been solved!
Explore an expertly crafted, step-by-step solution for a thorough understanding of key concepts.

This is a popular solution

Trending nowThis is a popular solution!

Step by stepSolved in 2 steps

Knowledge Booster

Similar questions
- A regression was run to determine if there is a relationship between hours of TV watched per day (x) and number of situps a person can do (y).The results of the regression were: y=a+bx b=-0.997 a=20.107 r2=0.950625 r=-0.975 Use this to predict the number of situps a person who watches 0.5 hours of TV can do.Round to one decimal place.arrow_forwardA regression was run to determine if there is a relationship between hours of TV watched per day (x) and number of situps a person can do (y). The results of the regression were: y=a+bx b=-0.993 a=29.135 r2=0.463761 r=-0.681 Use this to predict the number of situps a person who watches 6 hours of TV can do. Round to one decimal place.arrow_forwardA regression analysis was performed to determine if there is a relationship between hours of TV watched per day (x) and number of sit ups a person can do (y ). The results of the regression were: y=ax+b a=-1.33 b=25.138 r2=0.712336 r=-0.844 Use this to predict the number of sit ups a person who watches 10 hours of TV can do, and please round your answer to a whole number.arrow_forward
- A regression was run to determine if there is a relationship between hours of TV watched per day (x) and number of situps a person can do (y). The results of the regression were: y = a x + b a = -1.043 b = 29.088 %3D %3! r2 = 0.390625 r = -0.625 Use this to predict the number of situps a person who watches 6.5 hours of TV can do. situps : %3D [one decimal accuracy1arrow_forwardA regression was run to determine if there is a relationship between hours of TV watched per day (x) and number of situps a person can do (y).The results of the regression were:y=a+bx b=-1.127 a=25.258 r2=0.695556 r=-0.834 Use this to predict the number of situps a person who watches 8 hours of TV can do. Round to one decimal place.arrow_forwardA regression was run to determine if there is a relationship between hours of TV watched per day (xx) and number of situps a person can do (yy).The results of the regression were:y=ax+b a=-0.629 b=39.045 r2=0.806404 r=-0.898 Use this to predict the number of situps a person who watches 6.5 hour(s) of TV can do, and please round your answer to a whole number.arrow_forward
arrow_back_ios
arrow_forward_ios
Recommended textbooks for you
- Advanced Engineering MathematicsAdvanced MathISBN:9780470458365Author:Erwin KreyszigPublisher:Wiley, John & Sons, Incorporated
 Numerical Methods for EngineersAdvanced MathISBN:9780073397924Author:Steven C. Chapra Dr., Raymond P. CanalePublisher:McGraw-Hill Education
 Introductory Mathematics for Engineering Applicat...Advanced MathISBN:9781118141809Author:Nathan KlingbeilPublisher:WILEY
  Mathematics For Machine TechnologyAdvanced MathISBN:9781337798310Author:Peterson, John.Publisher:Cengage Learning,

Advanced Engineering Mathematics
Advanced Math
ISBN:9780470458365
Author:Erwin Kreyszig
Publisher:Wiley, John & Sons, Incorporated
Numerical Methods for Engineers
Advanced Math
ISBN:9780073397924
Author:Steven C. Chapra Dr., Raymond P. Canale
Publisher:McGraw-Hill Education
Introductory Mathematics for Engineering Applicat...
Advanced Math
ISBN:9781118141809
Author:Nathan Klingbeil
Publisher:WILEY
Mathematics For Machine Technology
Advanced Math
ISBN:9781337798310
Author:Peterson, John.
Publisher:Cengage Learning,