
MATLAB: An Introduction with Applications
6th Edition
ISBN: 9781119256830
Author: Amos Gilat
Publisher: John Wiley & Sons Inc
expand_more
expand_more
format_list_bulleted
Related questions
Question
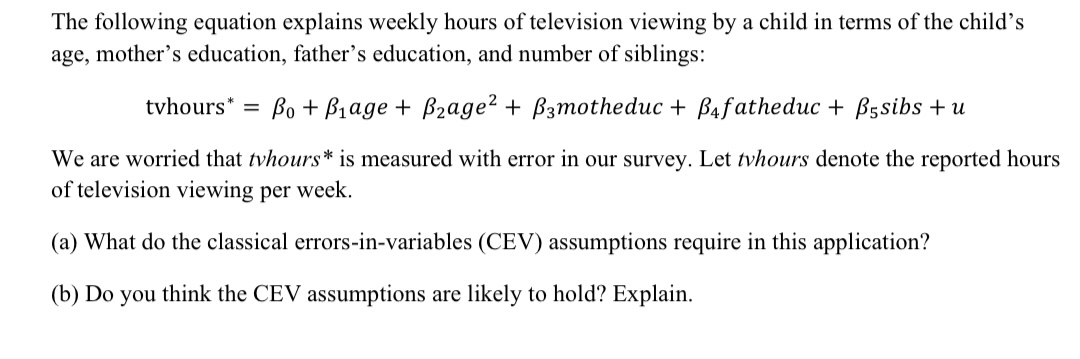

Transcribed Image Text:The following equation explains weekly hours of television viewing by a child in terms of the child's
age, mother's education, father's education, and number of siblings:
tvhours* =
Bo + B1age + B2age? + B3motheduc + Bafatheduc + B5sibs + u
We are worried that tvhours* is measured with error in our survey. Let tvhours denote the reported hours
of television viewing per week.
(a) What do the classical errors-in-variables (CEV) assumptions require in this application?
(b) Do you think the CEV assumptions are likely to hold? Explain.
Expert Solution
This question has been solved!
Explore an expertly crafted, step-by-step solution for a thorough understanding of key concepts.

This is a popular solution

Trending nowThis is a popular solution!

Step by stepSolved in 3 steps with 3 images

Knowledge Booster

Similar questions
- Trying to determine the number of students to accept is a tricky task for universities. The Admissions staff at a small private college wants to use data from the past few years to predict the number of students enrolling in the university from those who are accepted by the university. The data are provided in the following table. R F eTextbook and Media Save for Late O % 5 T O >> G H (9) 2 Number Accepted Number Enrolled Find the correlation between the number of students accepted and enrolled. Use two decimal places in your answer. & 2,440 2,800 2,720 2,360 2,660 2,620 8 6 611 K 708 637 584 614 625 ( 9 L Attempts: 0 of 1 used ) 0 P Submit Answer 56°F Cl Backspaarrow_forwardIf a data set has an even number of observations, the medianarrow_forwardResearchers wondered whether the size of a person's brain was related to the individual's mental capacity. They selected a sample of 5 females and 5 males and measured their MRI image pixel counts and IQ scores. Females Males MRI IQ MRI IG The data is reported to the right. Complete parts (a) through (d) below 139 858,472 140 955,003 935,494 924,059 1.079.550 1,001.121 Click the icon to view the critical values table. 991,305 138 141 857,782 833,868 790,619 133 135 132 141 135 140 AMRI 1,080,000- AIO 145 AIO 145- AMRI 1,080,000 780,000 130 130 780,000 130 780,000 780,000 130 1,080,000 145 1,080,000 MRI 145 MRI (b) Compute the linear correlation coefficient between MRI count and IQ. Are MRI count and IQ linearly related? Select the correct choice below and, if necessary, fill in the answer box to complete your choice. (Round to three decimal places as needed.) A. Yes, MRI count and IQ are linearly related since the linear correlation coefficient is O B. No. MRI count and IQ are not…arrow_forward
- A survey was conducted on how many texts (in average) students receive during an in-person class time. A survey data in a class in a particular day is given in the table. Number students Number of texts 1 20 2 14 12 4 5 If the average number texts that students received during this class time is 3, then determine the number of students (the value of x) that received 5 texts during the class time on that particular day.arrow_forwardQ.2) A manager at the delivery company recorded the mean and median delivery cost, but unfortunately lost the paper on which the values were recorded. However, the manager can remember that one value was about $4.00 and the other was about $4.40. Which value is the mean and which is the median? i. $4.00 is the mean and $4.40 is the median. ii. ii. $4.40 is the mean and $4.00 is the median. iii. It's impossible to tell which is which. 111. Q.3) Which of the following sets of four numbers has the largest standard deviation? (а) 100, 101, 102, 103 (b) 7, 8, 9, 10 (с) 5, 5, 5, 5 (d) 0, 1, 2, 3 (e) 0, 0, 10, 10arrow_forwardIf the median of a data set is 134 and the mean is 177, which of the following is most likely?arrow_forward
- b and carrow_forwardA record of a chess match records the chess piece used, the location of the piece and the length of time used to make the move. Classify each variable as qualitative or quantitative. A sample data table is listed below Piece Location pawn B3 rook C7 queen A6 0000 Move time (in seconds) 65 84 53 Piece - qualitative; location - quantitative; move time - quantitative Piece - quantitative; location - quantitative; move time - qualitative Piece - qualitative; location - qualitative; move time - quantitative Piece - qualitative; location - quantitative; move time - qualitativearrow_forwardA report states that the mean household income last year for a certain rural county was $55,300 and the median was $62,800. If a histogram were constructed for the incomes of all households in the county, would you expect it to be skewed to the right, skewed to the left, or approximately symmetric? Answer is Blank 1 ( don't hand writing solution)arrow_forward
arrow_back_ios
arrow_forward_ios
Recommended textbooks for you
- MATLAB: An Introduction with ApplicationsStatisticsISBN:9781119256830Author:Amos GilatPublisher:John Wiley & Sons Inc
 Probability and Statistics for Engineering and th...StatisticsISBN:9781305251809Author:Jay L. DevorePublisher:Cengage Learning
 Statistics for The Behavioral Sciences (MindTap C...StatisticsISBN:9781305504912Author:Frederick J Gravetter, Larry B. WallnauPublisher:Cengage Learning
  Elementary Statistics: Picturing the World (7th E...StatisticsISBN:9780134683416Author:Ron Larson, Betsy FarberPublisher:PEARSON
 The Basic Practice of StatisticsStatisticsISBN:9781319042578Author:David S. Moore, William I. Notz, Michael A. FlignerPublisher:W. H. Freeman
 Introduction to the Practice of StatisticsStatisticsISBN:9781319013387Author:David S. Moore, George P. McCabe, Bruce A. CraigPublisher:W. H. Freeman
MATLAB: An Introduction with Applications
Statistics
ISBN:9781119256830
Author:Amos Gilat
Publisher:John Wiley & Sons Inc
Probability and Statistics for Engineering and th...
Statistics
ISBN:9781305251809
Author:Jay L. Devore
Publisher:Cengage Learning
Statistics for The Behavioral Sciences (MindTap C...
Statistics
ISBN:9781305504912
Author:Frederick J Gravetter, Larry B. Wallnau
Publisher:Cengage Learning
Elementary Statistics: Picturing the World (7th E...
Statistics
ISBN:9780134683416
Author:Ron Larson, Betsy Farber
Publisher:PEARSON
The Basic Practice of Statistics
Statistics
ISBN:9781319042578
Author:David S. Moore, William I. Notz, Michael A. Fligner
Publisher:W. H. Freeman
Introduction to the Practice of Statistics
Statistics
ISBN:9781319013387
Author:David S. Moore, George P. McCabe, Bruce A. Craig
Publisher:W. H. Freeman