MATLAB: An Introduction with Applications
6th Edition
ISBN: 9781119256830
Author: Amos Gilat
Publisher: John Wiley & Sons Inc
expand_more
expand_more
format_list_bulleted
Topic Video
Question
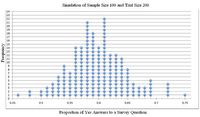
The following dot plot shows the results of a simulation
Given the mean of the sample proportion is x=0.60 , what would be a likely use of the random numbers used in the simulation to generate the dot plot data? (4 points)
| a |
Generate 100 numbers randomly using the digits 0 through 9, select 0 through 3 to represent a success and the digits 4 through 9 to represent not a success, run the trial 200 times, and plot the results on a proportion-frequency dot plot
|
| b |
Generate 10 numbers randomly using the digits 0 through 9, select 0 through 3 to represent a success and the digits 4 through 9 to represent not a success, run the trial 100 times, and plot the results on a proportion-frequency dot plot
|
| c |
Generate 100 numbers randomly using the digits 0 through 9, select 0 through 5 to represent a success and the digits 6 through 9 to represent not a success, run the trial 200 times, and plot the results on a proportion-frequency dot plot
|
| d |
Generate 100 numbers randomly using the digits 0 through 9, select 0 through 4 to represent a success and the digits 5 through 9 to represent not a success, run the trial 100 times, and plot the results on a proportion-frequency dot plot
|

Transcribed Image Text:Simulation of Sample Size 100 and Trial Size 200
24
23
22
21
20
19
18
17
16
15
14
13
7
6
3
2
0.45
0.5
0.55
0.6
0.65
0.7
0.75
Proportion of Yes Answers to a Survey Question
Frequency
Expert Solution
This question has been solved!
Explore an expertly crafted, step-by-step solution for a thorough understanding of key concepts.
This is a popular solution
Trending nowThis is a popular solution!
Step by stepSolved in 2 steps

Knowledge Booster
Learn more about
Need a deep-dive on the concept behind this application? Look no further. Learn more about this topic, statistics and related others by exploring similar questions and additional content below.Similar questions
- The test scores of 16 students are listed below: 44, 46, 51, 57, 60, 63, 65, 70, 75, 76, 85, 87, 90, 94, 95, 97. (c) Find the third quartile of the above data.arrow_forwardHere is a random sample of 20 Target Store shoppers and the number of items purchased: 32, 11, 45, 17, 35, 8, 42, 24, 13, 46, 23, 19, 14, 15, 36, 23, 8, 32, 16, 39 Construct an ordered Stem and Leaf plot by hand using your pencil and paper. In the essay text box, type in the leaf values that are on your stem for 3 (30's).arrow_forwardA study was conducted to see of airbags save lives. The table below lists the results from a simple random sample of front-seat occupants involved in car crashes. Airbag Available No Airbag Available Occupant Fatalities 41 52 Total number of occupants 11,541 9,853 What is the sample proportion of fatalities where there were no airbags available, p2? What is the difference in the two proportions, D? What is the standard error of the difference, SED?arrow_forward
- The mean of the distribution of sample means would be equal to:arrow_forwardSuppose I want to sample the household incomes for EBR parish. Let's say I start with a simple random sample of 100 residents and calculate the sample mean. How would the sampling distribution of change if I increase the sample size to 1,000 residents?arrow_forwardThe first pic is the question, since I’ve been receiving some incorrect answers from the tutors, I included an example problem in the second pic.arrow_forward
arrow_back_ios
arrow_forward_ios
Recommended textbooks for you
 MATLAB: An Introduction with ApplicationsStatisticsISBN:9781119256830Author:Amos GilatPublisher:John Wiley & Sons Inc
 Probability and Statistics for Engineering and th...StatisticsISBN:9781305251809Author:Jay L. DevorePublisher:Cengage Learning
 Statistics for The Behavioral Sciences (MindTap C...StatisticsISBN:9781305504912Author:Frederick J Gravetter, Larry B. WallnauPublisher:Cengage Learning
 Elementary Statistics: Picturing the World (7th E...StatisticsISBN:9780134683416Author:Ron Larson, Betsy FarberPublisher:PEARSON
 The Basic Practice of StatisticsStatisticsISBN:9781319042578Author:David S. Moore, William I. Notz, Michael A. FlignerPublisher:W. H. Freeman
 Introduction to the Practice of StatisticsStatisticsISBN:9781319013387Author:David S. Moore, George P. McCabe, Bruce A. CraigPublisher:W. H. Freeman

MATLAB: An Introduction with Applications
Statistics
ISBN:9781119256830
Author:Amos Gilat
Publisher:John Wiley & Sons Inc

Probability and Statistics for Engineering and th...
Statistics
ISBN:9781305251809
Author:Jay L. Devore
Publisher:Cengage Learning

Statistics for The Behavioral Sciences (MindTap C...
Statistics
ISBN:9781305504912
Author:Frederick J Gravetter, Larry B. Wallnau
Publisher:Cengage Learning

Elementary Statistics: Picturing the World (7th E...
Statistics
ISBN:9780134683416
Author:Ron Larson, Betsy Farber
Publisher:PEARSON

The Basic Practice of Statistics
Statistics
ISBN:9781319042578
Author:David S. Moore, William I. Notz, Michael A. Fligner
Publisher:W. H. Freeman

Introduction to the Practice of Statistics
Statistics
ISBN:9781319013387
Author:David S. Moore, George P. McCabe, Bruce A. Craig
Publisher:W. H. Freeman