
MATLAB: An Introduction with Applications
6th Edition
ISBN: 9781119256830
Author: Amos Gilat
Publisher: John Wiley & Sons Inc
expand_more
expand_more
format_list_bulleted
Related questions
Question
Subject: statistics
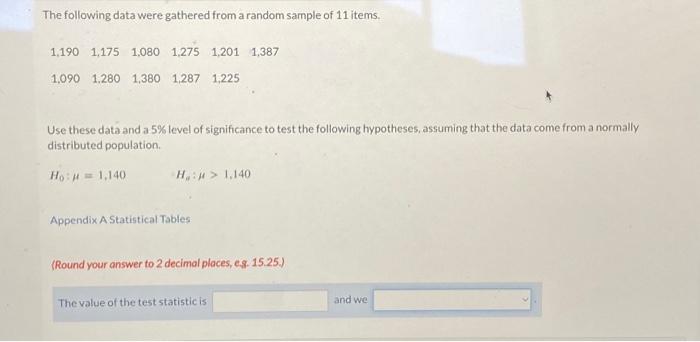

Transcribed Image Text:The following data were gathered from a random sample of 11 items.
1,190 1,175 1.080 1.275 1,201 1,387
1,090 1.280 1,380 1,287 1,225
Use these data and a 5% level of significance to test the following hypotheses, assuming that the data come from a normally
distributed population.
Ho: = 1,140
H: > 1,140
Appendix A Statistical Tables
(Round your answer to 2 decimal places, e.g. 15.25.)
The value of the test statistic is
and we
Expert Solution
This question has been solved!
Explore an expertly crafted, step-by-step solution for a thorough understanding of key concepts.

This is a popular solution

Trending nowThis is a popular solution!

Step by stepSolved in 3 steps with 1 images

Knowledge Booster

Similar questions
- find 5th deciels for given data 12,15,42,3,26,36,6,56,32,25,29,67,32,30arrow_forwardhow do you determine how many observations are in the first class of a stem and leaf chartarrow_forwardAbdomen data: 83.0, 87.9, 85.2, 88.6, 77.1, 85.3, 100.0, 94.4, 81.9, 88.5, 82.5, 100.5, 76.5, 86.4, 90.7, 83.6, 106.8, 77.6, 102.9, 90.9, 79.7, 73.9, 79.1, 72.8, 88.2, 100.1, 89.6, 95.9, 98.8, 76.3, 83.5 105.0, 90.8, 83.5, 84.5 101.8, 76.6, 76.4, 88.7, 92.4, 81.2, 91.6, 97.5, 80.0, 88.7, 100.5, 95.6, 92.1, 96.4, 74.6, 83.4, 106.0, 96.4, 92.8, 95.1, 90.4, 100.4, 115.9, 90.8, 81.9, 75.0, 90.3, 90.3, 108.8, 79.4, 83.2, 110.3, 91.6, 92.7, 76.0, 79.5, 86.1, 104.5, 104.6 Assume that the abdomen circumference of males have a distribution that isapproximately bell-shaped. Using the mean (= 89.7) and standard deviation (=9.9) as estimates of the population mean and standard deviation, a. Construct a diagram, using the Empirical Rule, to illustrate the percentagesof data values in each of the 8 sections that diagram includes.b. Between what two measurements will about 95% of the abdomencircumferences fall?arrow_forward
- find mode of the data 2,3,4,5,6,7,7,6,5,5,5,4,2,1,0,10,77,88,arrow_forward• Accountant• Executive Secretary• Data Entry• Engineer• Human Resources Specialist• Sales Representative• Director of Administrative and Financial Affairs How can I rank and value these jobs using simple ranking method?arrow_forward
arrow_back_ios
arrow_forward_ios
Recommended textbooks for you
- MATLAB: An Introduction with ApplicationsStatisticsISBN:9781119256830Author:Amos GilatPublisher:John Wiley & Sons Inc
 Probability and Statistics for Engineering and th...StatisticsISBN:9781305251809Author:Jay L. DevorePublisher:Cengage Learning
 Statistics for The Behavioral Sciences (MindTap C...StatisticsISBN:9781305504912Author:Frederick J Gravetter, Larry B. WallnauPublisher:Cengage Learning
  Elementary Statistics: Picturing the World (7th E...StatisticsISBN:9780134683416Author:Ron Larson, Betsy FarberPublisher:PEARSON
 The Basic Practice of StatisticsStatisticsISBN:9781319042578Author:David S. Moore, William I. Notz, Michael A. FlignerPublisher:W. H. Freeman
 Introduction to the Practice of StatisticsStatisticsISBN:9781319013387Author:David S. Moore, George P. McCabe, Bruce A. CraigPublisher:W. H. Freeman
MATLAB: An Introduction with Applications
Statistics
ISBN:9781119256830
Author:Amos Gilat
Publisher:John Wiley & Sons Inc
Probability and Statistics for Engineering and th...
Statistics
ISBN:9781305251809
Author:Jay L. Devore
Publisher:Cengage Learning
Statistics for The Behavioral Sciences (MindTap C...
Statistics
ISBN:9781305504912
Author:Frederick J Gravetter, Larry B. Wallnau
Publisher:Cengage Learning
Elementary Statistics: Picturing the World (7th E...
Statistics
ISBN:9780134683416
Author:Ron Larson, Betsy Farber
Publisher:PEARSON
The Basic Practice of Statistics
Statistics
ISBN:9781319042578
Author:David S. Moore, William I. Notz, Michael A. Fligner
Publisher:W. H. Freeman
Introduction to the Practice of Statistics
Statistics
ISBN:9781319013387
Author:David S. Moore, George P. McCabe, Bruce A. Craig
Publisher:W. H. Freeman