MATLAB: An Introduction with Applications
6th Edition
ISBN: 9781119256830
Author: Amos Gilat
Publisher: John Wiley & Sons Inc
expand_more
expand_more
format_list_bulleted
Question

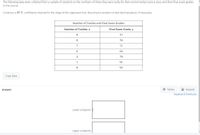
Transcribed Image Text:The following data were collected from a sample of students on the numbers of times they were tardy for their enviromental science class and their final exam grades
in the course.
Construct a 95 % confidence interval for the slope of the regression line. Round your answers to two decimal places, if necessary.
Number of Tardies and Final Exam Grades
Number of Tardies, x
Final Exam Grade, y
9
57
8
59
7
71
6
66
4
78
1
91
94
Copy Data
囲 Tables
I Keypad
Answer
Keyboard Shortcuts
Lower endpoint:
Upper endpoint:
Expert Solution
This question has been solved!
Explore an expertly crafted, step-by-step solution for a thorough understanding of key concepts.
This is a popular solution
Trending nowThis is a popular solution!
Step by stepSolved in 2 steps with 3 images

Knowledge Booster
Similar questions
- In this question, we investigate the relationship between the top (maximum) speed (mph) and maximum height for a random sample of roller coasters in the United States. Here is the scatterplot and a summary of the simple linear regression model. Construct a 95% confidence interval for the true slope of the regression line and interpret your confidence interval in context.arrow_forwardQ9 The explanatory variable in linear correlation/regression model is recorded on which of thesemeasurement scales: A. categorical B. ordinal C. quantitative D. none of the abovearrow_forwardPlease answer... I'm needed only 1 hours time to dd .... Thank uarrow_forward
- The following regression is fitted using variables identified that could be related to student requestedloan amount, LOAN-AMT($) for returning students of a certain University. ????−??? = ? + ? ?????? + ? ???? + ? ????Where ACCEPT = the percentage of applicants that was accepted by the university, PREV = previous loan amount and OUTS =outstanding loan amountThe data was processed using MNITAB and the following is an extract of the output obtained:EXHIBIT 2Predictor Coef StDev T PConstant -26780 6115 * 0.000ACCEPT 116.00 37.17 3.14 0.003PREV -4.21 14.12 -0.30 **OUTS 70.85 15.77 4.49 0.000S = 2685 R-Sq = 69.6% R-Sq(adj) = 67.7%Analysis of VarianceSource DF SS MS F PRegression 3 808139371 269379790 37.37 0.00Residual Error 49 353193051 7208021Total 52 1161332421a)What is dependent and independent variables? b)Fully write out the regression equation c)What is the sample size used in this investigation? d)Fill in the blanks identified by ‘*’ and ‘**’. e)Is β significant, at the 5% level of…arrow_forwardThe local utility company surveys 12 randomly selected customers. For each survey participant, the company collects the following: annual electric bill (in dollars) and home size (in square feet). Output from a regression analysis appears below: Bill 13.45 + 4.39*Size Coefficients Estimate Std. Error (Intercept) 13.45 Size 4.39 0.54 0.2 We are 90% confident that the mean annual electric bill increases by between dollars and dollars for every additional square foot in home size. Round your answers to three decimal places and enter in increasing order.arrow_forwardPLEASE ANSWER 4,5 AND 6arrow_forward
- Please answer A,B, D, F, & G pls and thank you!arrow_forwardPrev The table below gives the age and bone density for five randomly selected women. Using this data, consider the equation of the regression line, y = bo + b₁x, for predicting a woman's bone density based on her age. Keep in mind, the correlation coefficient may or may not be statistically significant for the data given. Remember, In practice, it would not be appropriate to use the regression line to make a prediction if the correlation coefficient is not statistically significant. Age Bone Density 61 62 68 69 40 357 350 343 340 315 Step 1 of 6: Find the estimated slope. Round your answer to three decimal places. Table Copy Data Nextarrow_forwardHawk thinks his heartrate will increase as he increases his skateboarding speed. To see if this relationship exists, he records six different speeds and models it with a scatterplot and regression output. Part A: Write the equation of the regression line using the regression output. Part B: What do the slope and intercept parameters mean using the context of the problem? Part C: Compute the margin of error that Hawk should use if he wants to provide a 99% confidence interval for the slope. Assume that conditions for inference are satisfied.arrow_forward
arrow_back_ios
arrow_forward_ios
Recommended textbooks for you
 MATLAB: An Introduction with ApplicationsStatisticsISBN:9781119256830Author:Amos GilatPublisher:John Wiley & Sons Inc
 Probability and Statistics for Engineering and th...StatisticsISBN:9781305251809Author:Jay L. DevorePublisher:Cengage Learning
 Statistics for The Behavioral Sciences (MindTap C...StatisticsISBN:9781305504912Author:Frederick J Gravetter, Larry B. WallnauPublisher:Cengage Learning
 Elementary Statistics: Picturing the World (7th E...StatisticsISBN:9780134683416Author:Ron Larson, Betsy FarberPublisher:PEARSON
 The Basic Practice of StatisticsStatisticsISBN:9781319042578Author:David S. Moore, William I. Notz, Michael A. FlignerPublisher:W. H. Freeman
 Introduction to the Practice of StatisticsStatisticsISBN:9781319013387Author:David S. Moore, George P. McCabe, Bruce A. CraigPublisher:W. H. Freeman

MATLAB: An Introduction with Applications
Statistics
ISBN:9781119256830
Author:Amos Gilat
Publisher:John Wiley & Sons Inc

Probability and Statistics for Engineering and th...
Statistics
ISBN:9781305251809
Author:Jay L. Devore
Publisher:Cengage Learning

Statistics for The Behavioral Sciences (MindTap C...
Statistics
ISBN:9781305504912
Author:Frederick J Gravetter, Larry B. Wallnau
Publisher:Cengage Learning

Elementary Statistics: Picturing the World (7th E...
Statistics
ISBN:9780134683416
Author:Ron Larson, Betsy Farber
Publisher:PEARSON

The Basic Practice of Statistics
Statistics
ISBN:9781319042578
Author:David S. Moore, William I. Notz, Michael A. Fligner
Publisher:W. H. Freeman

Introduction to the Practice of Statistics
Statistics
ISBN:9781319013387
Author:David S. Moore, George P. McCabe, Bruce A. Craig
Publisher:W. H. Freeman