
MATLAB: An Introduction with Applications
6th Edition
ISBN: 9781119256830
Author: Amos Gilat
Publisher: John Wiley & Sons Inc
expand_more
expand_more
format_list_bulleted
Related questions
Question
thumb_up100%
The following data table shows the historical data for the first semester 2020, of the amount of sales of the company "IRC", which sells sneakers.
Utilizing multiple lineal regression (as shown on the image), find an equation that estimates the number of sneakers sold by the company, based on advertising and revenue. Also, determine the standard error of estimation, the coefficient of determination, and the
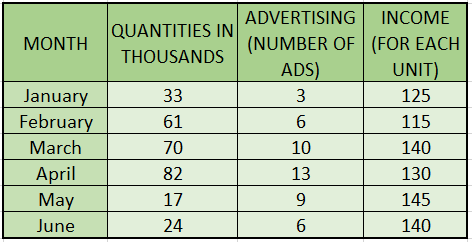

Transcribed Image Text:MONTH
January
February
March
April
May
June
QUANTITIES IN
THOUSANDS
33
61
70
82
17
24
ADVERTISING
(NUMBER OF
ADS)
3
6
10
13
9
6
INCOME
(FOR EACH
UNIT)
125
115
140
130
145
140

Transcribed Image Text:Multiple linear regression:
y = ao + αι*1 + azXz + e
Τ
s, = Σ wi-ao-a1x1 - 0272)
i=1
Standard error:
Sy =
S,
n – (m + 1)
dS,
λαο
asr
θαι
as,
dan
= -2
Σ
Oi - ad - arxai - antzi)
2Σ xaily; - ag
= -2
a1x1; – €2X2;)
22 x26; - an – anti - A2821)
y = do + arxi tantz tit am*m te
*1
X21
Στι
(ao)
Σχει Σχει Σχεσει {0}= Σκινι
Σχει Σκοτ Σχει
Σχεινε)
n
Determination coefficient:
12
St - S
St
Expert Solution
This question has been solved!
Explore an expertly crafted, step-by-step solution for a thorough understanding of key concepts.

Step by stepSolved in 5 steps with 1 images

Knowledge Booster

Similar questions
- A linear model fit to predict weekly Sales of frozen pizza (in kilograms) from the average Price (in dollars per unit) charged by a sample of stores in 41 recent weeks is Sales = 141,870.25-24,445.32 Price. For the data used to create the model, the average Sales was 52,750 kilograms (SD = 10,282 kilograms) and the correlation between Price and Sales was r=-0.554. If the Price in a particular week was 2 SD higher than the mean Price, how much pizza would the model predict was sold that week? The model would predict that kilograms of frozen pizza were sold. (Round to the nearest integer as needed.)arrow_forwardwrite the regression equation that will predict the number of manatees killed given thenumber of powerboat registrations (in 1000's). Show all work usingformulas for slope, b1, and y-intercept, b0, calculations roundingto 4-decimal places, if necessary. Show all the calculations and math of slope, b1, and y-intercept, b0, calculations roundingto 4-decimal places, if necessary. SHOW ALL WORK! DO NOT USE EXCEL! I need to be able to see every single part and how you got it. attached is the questionarrow_forwardWhile attempting to measure its risk exposure for the upcoming year, an insurance company notices a trend between the age of a customer and the number of claims per year. It appears that the number of claims keep going up as customers age. After performing a regression, they find that the relationship is (claims per year) = 0.385*(age) + 5.218. If a customer is 44.315 years old and they make an average of 11.239 claims per year, the residual is -11.04. Interpret this residual in terms of the problem. Question 10 options: 1) The number of claims per year is 11.04 claims less than what we would expect. 2) The age is 11.04 years larger than what we would expect. 3) The age is 11.04 years less than what we would expect. 4) The number of claims per year is 11.239 claims less than what we would expect. 5) The number of claims per year is 11.04 claims…arrow_forward
- Use the following to answer the question: y^=-4.2x+9.5 with R2=9%. Which best describes the correlation? Weak negative linear relationship Moderate negative linear relationship Weak positive linear relationship No linear relationship Moderate positive linear relationshiparrow_forwardThe table shows the amounts of crude oil (in thousands of barrels per day) produced by a certain country and the amounts of crude oil (in thousands of barrels per day) imported by the same country for seven years. The equation of the regression line is y=−1.326x+16,981.04. Complete parts (a) and (b) below. Produced,_x 5,789 5,679, 5,626, 5,407, 5,234, 5,138, 5,094 Imported,_y 9,309 9,130, 9,681, 10,090, 10,151, 10,152, 10,017 (a) Find the coefficient of determination and interpret the result. r2= (Round to three decimal places as needed.) (b) Find the standard error of estimate se and interpret the result. Se= (Round to three decimal places as needed.)arrow_forwardThe following regression equation is based on the analysis of four variables: SM_DOLLARS is the dollar amount of a watershed conservation agency's weekly spending on social media ads. RADIO_ADS is the number of radio advertisements aired weekly by the agency. WS_DOLLARS is the dollar amount of the agency’s weekly spending on web search ads. The variable WEB_VISITS is the number of weekly visitors to their educational website. These data have been recorded every week for the past three years. WEB_VISITS (expected) = 109 + 0.2*SM_DOLLARS + 1.5*RADIO_ADS + 1.1*WS_DOLLARS The data meet the assumptions for regression analysis, and the regression results, including the coefficients, were found to be statistically significant. How many additional weekly web visits would you predict when the agency increases its weekly spending on social media ads by $150 without changing the amount spent on radio ads or web search ads? (Round your answer to the nearest whole number.)arrow_forward
- The following regression equation is based on the analysis of four variables: SM_DOLLARS is the dollar amount of a watershed conservation agency's weekly spending on social media ads. RADIO_ADS is the number of radio advertisements aired weekly by the agency. WS_DOLLARS is the dollar amount of the agency’s weekly spending on web search ads. The variable WEB_VISITS is the number of weekly visitors to their educational website. These data have been recorded every week for the past three years. WEB_VISITS (expected) = 208 + 1.5*SM_DOLLARS + 0.5*RADIO_ADS + 0.8*WS_DOLLARS The data meet the assumptions for regression analysis, and the regression results, including the coefficients, were found to be statistically significant. How many additional weekly web visits would you predict when the agency increases its weekly spending on social media ads by $108 without changing the amount spent on radio ads or web search ads? (Round your answer to the nearest whole number.)arrow_forwardwe can conclude from correlation calculation that one variable caused the other variable. True or False.arrow_forwardImagine that you, a social psychologist, study people living with HIV. You are interested in the relationship between viral load, the amount of HIV in a sample of blood, and perceived stigma, the amount people with HIV perceive others to hold stigmatizing views about their condition. You have 100 people with HIV complete a perceived stigma scale, as well as provide a sample of blood, so their viral load can be measured. You run a regression analysis using the data you’ve collected to see whether perceived stigma can be predicted based on viral load. The output from the analysis is presented below: How much does the estimate of perceived stigma change if viral load increases by one unit?arrow_forward
- Can that regression be used to estimate the effect of the national unemployment rate on an individual’s earnings? Explain.arrow_forwardThe accompanying table gives the stock market indices for a certain company on the stock market. Use simple linear regression to forecast the data. What would be the forecasts for the next three days? Please show work so I can learn how to do this problem in the future. Thanks! Select the graph that shows the correct trendline forecast for the given data. *Please graph the trendline forecast for the following stock market indices. What would be the forecast for the next three days? 10/02/2010 & index 10/03/2010 & index 10/04/2010 & index Date Index Date (numeric) 9/3/2010 10447.79 40424 9/7/2010 10342.64 40428 9/8/2010 10386.09 40429 9/9/2010 10415.14 40430 9/10/2010 10462.48 40431 9/13/2010 10542.22 40434 9/14/2010 10524.65 40435 9/15/2010 10572.29 40436 9/16/2010 10593.03 40437 9/17/2010 10607.22 40438 9/20/2010 10753.98 40441 9/21/2010 10759.62 40442 9/22/2010 10741.07 40443 9/23/2010 10663.56 40444 9/24/2010 10859.98 40445 9/27/2010…arrow_forwardA frequent flyer was interested in the relationship between dollars spent on flying and the distance flown. She sampled 20 frequent flyers of a certain airline. She collected the number of miles flown in the previous year and the total amount of money the flyer spent. A regression line of distance flown on money spent was fit to the data: y^=24000+10x. One person in the sample spent $3000 and flew 42,567 miles. What would be the residual (or error) in the predicted distance this person would fly?arrow_forward
arrow_back_ios
SEE MORE QUESTIONS
arrow_forward_ios
Recommended textbooks for you
- MATLAB: An Introduction with ApplicationsStatisticsISBN:9781119256830Author:Amos GilatPublisher:John Wiley & Sons Inc
 Probability and Statistics for Engineering and th...StatisticsISBN:9781305251809Author:Jay L. DevorePublisher:Cengage Learning
 Statistics for The Behavioral Sciences (MindTap C...StatisticsISBN:9781305504912Author:Frederick J Gravetter, Larry B. WallnauPublisher:Cengage Learning
  Elementary Statistics: Picturing the World (7th E...StatisticsISBN:9780134683416Author:Ron Larson, Betsy FarberPublisher:PEARSON
 The Basic Practice of StatisticsStatisticsISBN:9781319042578Author:David S. Moore, William I. Notz, Michael A. FlignerPublisher:W. H. Freeman
 Introduction to the Practice of StatisticsStatisticsISBN:9781319013387Author:David S. Moore, George P. McCabe, Bruce A. CraigPublisher:W. H. Freeman
MATLAB: An Introduction with Applications
Statistics
ISBN:9781119256830
Author:Amos Gilat
Publisher:John Wiley & Sons Inc
Probability and Statistics for Engineering and th...
Statistics
ISBN:9781305251809
Author:Jay L. Devore
Publisher:Cengage Learning
Statistics for The Behavioral Sciences (MindTap C...
Statistics
ISBN:9781305504912
Author:Frederick J Gravetter, Larry B. Wallnau
Publisher:Cengage Learning
Elementary Statistics: Picturing the World (7th E...
Statistics
ISBN:9780134683416
Author:Ron Larson, Betsy Farber
Publisher:PEARSON
The Basic Practice of Statistics
Statistics
ISBN:9781319042578
Author:David S. Moore, William I. Notz, Michael A. Fligner
Publisher:W. H. Freeman
Introduction to the Practice of Statistics
Statistics
ISBN:9781319013387
Author:David S. Moore, George P. McCabe, Bruce A. Craig
Publisher:W. H. Freeman