A First Course in Probability (10th Edition)
10th Edition
ISBN: 9780134753119
Author: Sheldon Ross
Publisher: PEARSON
expand_more
expand_more
format_list_bulleted
Question
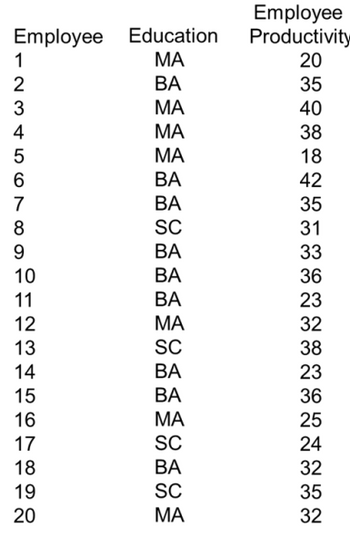
#2. The following data show the educational level and productivity of 20 employees in the City of Fullerton Social Services Agency. Set up a
Education: SC = some college, BA = bachelor’s, MA = master’s Productivity = number of cases completed per week by the employee

Transcribed Image Text:Employee Education
MA
BA
MA
MA
MA
BA
123456
7
8
9
10
11
12
13
14
15
16
17
18
19
20
BA
SC
BA
BA
BA
MA
SC
BA
BA
MA
SC
BA
SC
MA
Employee
Productivity
20
35
40
38
18
42
35
31
33
36
23
32
38
23
36
25
24
32
35
32
Expert Solution
This question has been solved!
Explore an expertly crafted, step-by-step solution for a thorough understanding of key concepts.
Step by stepSolved in 3 steps

Knowledge Booster
Similar questions
- Would you like a cup of tea? Carole and Julius are getting ready to open a new cafe and are gathering up information about sales of different drinks in their state. They obtain data containing the yearly sales (in $1000s) for three types of tea: Darjeeling, Earl Grey, and Green Tea. A boxplot of the data and a histogram of the sales for all three teas combined is shown below. Note: Clicking on any image in this problem will open it in a new window, allowing you to enlarge the view. Tea Sales by Product Combined Tea Sales Darjeeling Earl Grey Green Tea 100 200 300 400 Product Sales in $1000 Part 1: Use the plots above to make quantitative comparisons and answer the following questions: Quantity A: The 75th percentile (Q3) of Sales for Darjeeling Tea Quantity B: The 75th percentile (Q3) of Sales for Green Tea Quantity A is greater Quantity A: The median of Sales for Darjeeling Tea Quantity B: The median of Sales for Green Tea Quantity B is greater 00€ 007 Frequency > 000 008 007 Sales in…arrow_forwardVirginia polled a large sample of individuals to find the percentage of students with known food allergies and the percentage of students without known food allergies. Which of the following could sufficiently display the data if only the two given categories are to be included? Select the correct answer below: bar graph pie chart either a pie chart or a bar graph neither a pie chart nor a bar grapharrow_forwardIn a study, researchers wanted to measure the effect of alcohol on the hippocampal region, the portion of the brain responsible for long-term memory storage, in adolescents. The researchers randomly selected 23 adolescents with alcohol use disorders to determine whether the hippocampal volumes in the alcoholic adolescents were less than the normal volume of 9.02 cm. An analysis of the sample data revealed that the hippocampal volume is approximately normal with no outliers and x 8.18 cm and s=0.8 cm. Conduct the appropriate test at the a= 0.01 level of significance. State the null and alternative hypotheses. Ho: H H1: (Type integers or decimals. Do not round.) Identify the t-statistic. to = (Round to two decimal places as needed.) !! Identify the P-value. P-value = (Round to three decimal places as needed.) Make a conclusion regarding the hypothesis. the null hypothesis. There sufficient evidence to claim that the mean hippocampal volume is cm³ Statcrunch Next 8:01 SAMSUNG esc @ %23 $…arrow_forward
- Classify each of the following data types as qualitative or quantitative. 1. Types of animals used as NFL football team mascots 2. Weight of kindergarten students 3. Height of sycamore trees 4. Dollars earned by actor 5. Colors people use to paint their housesarrow_forwardDetermine whether the following examples are discrete or continuous data sets. Write "DISCRETE" for discrete and "CONTINUOUS" for continuous. (without quotations - use for instance copy and paste to avoid typos) (a) The number of voters who vote Democratic answer. (b) The temperature in any given location. answer. (C) The distance traveled by a city bus each day. answer. (d) The length of time needed for a student to complete a homework assignment. answerarrow_forwardTYPEWRITTEN ONLY PLEASE FOR UPVOTE. DOWNVOTE FOR HANDWRITTEN. DO NOT ANSWER IF YOU ALREADY ANSWERED THIS. I'LL DOWNVOTE.arrow_forward
arrow_back_ios
arrow_forward_ios
Recommended textbooks for you
 A First Course in Probability (10th Edition)ProbabilityISBN:9780134753119Author:Sheldon RossPublisher:PEARSON

A First Course in Probability (10th Edition)
Probability
ISBN:9780134753119
Author:Sheldon Ross
Publisher:PEARSON
