MATLAB: An Introduction with Applications
6th Edition
ISBN: 9781119256830
Author: Amos Gilat
Publisher: John Wiley & Sons Inc
expand_more
expand_more
format_list_bulleted
Question
Please compute the Durbin Watson test statistic and show work.

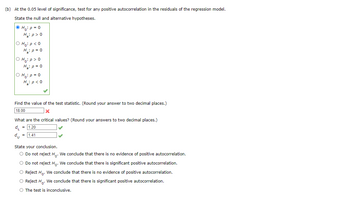
Transcribed Image Text:(b) At the 0.05 level of significance, test for any positive autocorrelation in the residuals of the regression model.
State the null and alternative hypotheses.
Ho p=0
H₂: p > 0
O Ho: p<0
O Ho:p>O
O Hop=0
H₁₂: p<0
Find the value of the test statistic. (Round your answer to two decimal places.)
18.00
What are the critical values? (Round your answers to two decimal places.)
du
= 1.20
= 1.41
State your conclusion.
Do not reject Ho. We conclude that there is no evidence of positive autocorrelation.
Do not reject Ho. We conclude that there is significant positive autocorrelation.
Reject Ho. We conclude that there is no evidence of positive autocorrelation.
Reject Ho. We conclude that there is significant positive autocorrelation.
The test is inconclusive.

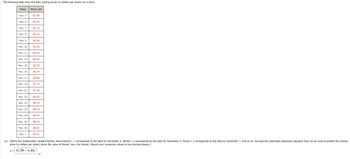
Transcribed Image Text:The following data show the daily closing prices (in dollars per share) for a stock.
Date
Price ($)
Nov. 3
82.85
Nov. 4
82.93
Nov. 7
83.70
Nov. 8
83.16
Nov. 9
82.90
Nov. 10
83.99
Nov. 11
84.59
Nov. 14
84.42
Nov. 15
85.55
Nov. 16
86.54
Nov. 17
86.84
Nov. 18
87.74
Nov. 21
87.39
Nov. 22
88.02
Nov. 23
88.79
Nov. 25
88.76
Nov. 28
89.04
Nov. 29
89.19
Nov. 30
88.91
Dec. 1
89.31
(a) Define the independent variable Period, where Period = 1 corresponds to the data for November 3, Period = 2 corresponds to the data for November 4, Period = 3 corresponds to the data for November 7, and so on. Develop the estimated regression equation that can be used to predict the closing
price (in dollars per share) given the value of Period. Use x for Period. (Round your numerical values to two decimal places.)
ŷ 81.99 0.40x
Expert Solution
This question has been solved!
Explore an expertly crafted, step-by-step solution for a thorough understanding of key concepts.
This is a popular solution
Trending nowThis is a popular solution!
Step by stepSolved in 2 steps with 2 images

Knowledge Booster
Similar questions
- A large software company gives job applicants a test of programming ability and the mean for that test has been 158 in the past. Twenty-five job applicants are randomly selected from one large university and they produce a mean score and standardndeviation of 183 and 13, respectively. Use a 0.05 level of significance to test the claim that this sample comes from a population with a mean score greater than 160. Use the P-value method of testing hypotheses.arrow_forwardThe Trial Urban District Assessment (TUDA) is a government-sponsored study of student achievement in large urban school districts. TUDA gives a mathematics test scored from 0 to 500. A score of 262 is a "basic" mathematics level, and a score of 299 is "proficient." Scores for a random sample of 1100 eighth-graders in Dallas had x = 264 with standard error 1.3. TUDA results for 2019 from the National Center for Education Statistics, at https://www.nationsreportcard.gov. O Macmillan Learning (b) Identify a 99% confidence interval for the mean score of all Dallas eighth-graders. (Be careful: the report gives the standard error of x, not the standard deviation s.) O 261.9 to 266.1 O260.6 to 267.4 O261.4 to 266.6 O 262.7 to 265.3arrow_forwardSuppose that you did a Right-Tailed Test and that the Observed Test Statistic is outside the Critical Region. Which is bigger, the Observed Test Statistic or the Critical Value?arrow_forward
- Please show five steps in hypothesis testing. When the sample size is larger than 30 for both samples, we assume the concerned sampling distribution approximates a normal curve, and we can compute the obtained z score. We also focus on the two-tailed test and the research/alternative hypothesis simply predicts the population means are different.arrow_forwardA team of engineers at Boeing is in charge of designing wings for jet aircraft. A certain part must be between 15.81 cm and 15.93 cm. Any lengths outside of that range could pose serious safety risks. Because of this, the engineers perform hypothesis tests for the mean length of the part with a very low level of significance. What type of error would be more serious for this hypothesis test, Type I, or Type II? Please explain your reasoning.arrow_forwardIs narcissism a more common personality trait today than it was a few decades ago? It is known that the mean population score on the Narcissistic Personality Inventory (NPI) for students attending University of South Alabama around 20 years ago was μ= 15 (Twenge, 2010). Interested in the narcissism levels of students in the year 2020, a researcher administers the NPI to a random sample of 25 University of Alabama sophomores this Spring term. The mean NPI score from the researcher’s sample of sophomores is M = 16.5, with s = 3.4. 1. Find the obtained (i.e., computed) test statistic for a sample (n=25) with a mean of 16.5 2. Make a statistical decision about the null. Will you reject or fail to reject the null based on your sample data? 3. Justify your decision about the null.arrow_forward
- A survey shows that 10% of the population is victimized by property crime each year. A random sample of 527 older citizens (65 years or more of age) show a victimize rate of 14%. are older people more likely to be victimized? conduct both one and two-tailed tests of significance.arrow_forwardA researcher is interested in studying mean gill beat rates for fish in water with three different levels of calcium. The results of the experiment are stored in below. Set up the null and alternative hypotheses. What is the mean square error? State the F-statistic of the test as well as the p-value of the test. What is the conclusion of the test, in context? Test which two levels of calcium are most likely to find a difference in mean gill rates. State all three pairwise hypothesis tests and the p-values for each test. Calcium GillRate Low 55 Low 63 Low 78 Low 85 Low 65 Low 98 Low 68 Low 84 Low 44 Low 87 Low 48 Low 86 Low 93 Low 64 Low 83 Low 79 Low 85 Low 65 Low 88 Low 47 Low 68 Low 86 Low 57 Low 53 Low 58 Low 47 Low 62 Low 64 Low 50 Low 45 Medium 38 Medium 42 Medium 63 Medium 46 Medium 55 Medium 63 Medium 36 Medium 58 Medium 73 Medium 69 Medium 55 Medium 68 Medium 63 Medium 73 Medium 45…arrow_forwardWhat are Experimental errors?arrow_forward
- The Trial Urban District Assessment (TUDA) is a government-sponsored study of student achievement in large urban school districts. TUDA gives a mathematics test scored from 0 to 500. A score of 262 is a "basic" mathematics level, and a score of 299 is "proficient." Scores for a random sample of 1100 eighth-graders in Dallas had x = 264 with standard error 1.3. TUDA results for 2019 from the National Center for Education Statistics, at https://www.nationsreportcard.gov. LO 5 DEC 1 S tv ♫ ♫ O Macmillan Learning (c) Is there good evidence that the mean for all Dallas eighth-graders is different from the basic level? F8 OYes, because the sample mean of 264 is not included in the 99% confidence interval. Yes, because the basic level of 262 is not included in the 99% confidence interval. O No, because the basic level of 262 is included in the 99% confidence interval. O No, because the sample mean of 264 is included in the 99% confidence interval. N 1917 66 7 A 72 P GE zoomarrow_forwardA data set includes data from 400 random tornadoes. The display from technology available below results from using the tornado lengths (miles) to test the claim that the mean tomado length is K greater than 2.6 miles. Use a 0.05 significance level. Identify the null and alternative hypotheses, test statistic, P-value, and state the final conclusion that addresses the original claim. Click the icon to view the display from technology. Assuming all conditions for conducting a hypothesis test are met, what are the null and alternative hypotheses? OA. Ho: H=2.6 miles H₁: #2.6 miles OC. Ho: H=2.6 miles H₁: 2.6 miles OD. Ho: <2.6 miles H₁: μ=2.6 milesarrow_forwardI need to turn this into a hypothesis test using a Ti84 As a dog owner I became curious as to the reason, why people choose to own a dog. I claim that more women choose to own a dog mainly for companionship than women who choose to have a large dog mainly for companionship. Do the data provide sufficient evidence to conclude that the proportion of women who prefer small dogs for companionship greater than the proportion of women who prefer large dogs for companionship? On Sunday, I will stand outside of my local Petco and survey women who are entering the store. I will ask if they own a dog, the main reason that they acquired a dog whether it was for protection or companionship and the size of their dog. I will collect this data in my notebook. I will not collect data from people exiting the store to ensure that I do not survey the same person more than once. I will acquire 30 samples of women who own small dogs and 30 women who own large dogs. I will not include women under the…arrow_forward
arrow_back_ios
SEE MORE QUESTIONS
arrow_forward_ios
Recommended textbooks for you
 MATLAB: An Introduction with ApplicationsStatisticsISBN:9781119256830Author:Amos GilatPublisher:John Wiley & Sons Inc
 Probability and Statistics for Engineering and th...StatisticsISBN:9781305251809Author:Jay L. DevorePublisher:Cengage Learning
 Statistics for The Behavioral Sciences (MindTap C...StatisticsISBN:9781305504912Author:Frederick J Gravetter, Larry B. WallnauPublisher:Cengage Learning
 Elementary Statistics: Picturing the World (7th E...StatisticsISBN:9780134683416Author:Ron Larson, Betsy FarberPublisher:PEARSON
 The Basic Practice of StatisticsStatisticsISBN:9781319042578Author:David S. Moore, William I. Notz, Michael A. FlignerPublisher:W. H. Freeman
 Introduction to the Practice of StatisticsStatisticsISBN:9781319013387Author:David S. Moore, George P. McCabe, Bruce A. CraigPublisher:W. H. Freeman

MATLAB: An Introduction with Applications
Statistics
ISBN:9781119256830
Author:Amos Gilat
Publisher:John Wiley & Sons Inc

Probability and Statistics for Engineering and th...
Statistics
ISBN:9781305251809
Author:Jay L. Devore
Publisher:Cengage Learning

Statistics for The Behavioral Sciences (MindTap C...
Statistics
ISBN:9781305504912
Author:Frederick J Gravetter, Larry B. Wallnau
Publisher:Cengage Learning

Elementary Statistics: Picturing the World (7th E...
Statistics
ISBN:9780134683416
Author:Ron Larson, Betsy Farber
Publisher:PEARSON

The Basic Practice of Statistics
Statistics
ISBN:9781319042578
Author:David S. Moore, William I. Notz, Michael A. Fligner
Publisher:W. H. Freeman

Introduction to the Practice of Statistics
Statistics
ISBN:9781319013387
Author:David S. Moore, George P. McCabe, Bruce A. Craig
Publisher:W. H. Freeman