
MATLAB: An Introduction with Applications
6th Edition
ISBN: 9781119256830
Author: Amos Gilat
Publisher: John Wiley & Sons Inc
expand_more
expand_more
format_list_bulleted
Related questions
Question
The following data (see attached image) has been collected. You collected 8 samples, every day for 10 days.
- What is X-double bar?
- What is R bar?
- What is the
sample size , n?
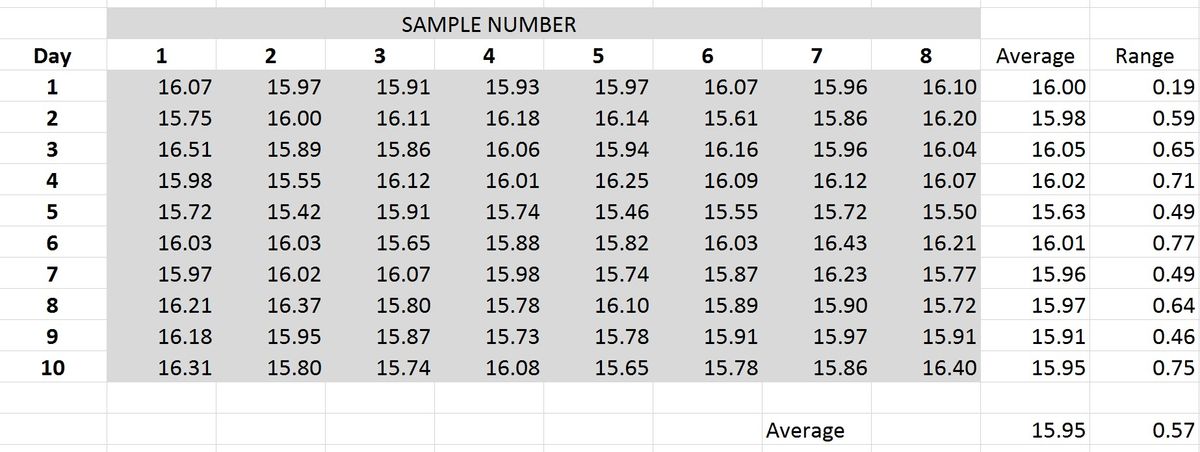

Transcribed Image Text:**Data Set Description:**
This table contains data representing sample measurements taken over ten days. Each day includes eight sample numbers. The table provides daily averages and ranges calculated from these samples.
**Table Details:**
- **Columns:**
- **Day:** Indicates the specific day (1 to 10) on which samples were taken.
- **Sample Number (1 to 8):** Represents individual sample measurements taken each day.
- **Average:** The average value of the samples for each day.
- **Range:** The difference between the highest and lowest sample values for each day.
**Data Values:**
1. **Day 1:**
Samples: 16.07, 15.97, 15.91, 15.93, 15.97, 16.07, 15.96, 16.10
Average: 16.00
Range: 0.19
2. **Day 2:**
Samples: 15.75, 16.00, 16.11, 16.18, 16.14, 15.61, 15.86, 16.20
Average: 15.98
Range: 0.59
3. **Day 3:**
Samples: 16.51, 15.89, 15.86, 16.06, 15.94, 16.16, 15.96, 16.04
Average: 16.05
Range: 0.65
4. **Day 4:**
Samples: 15.98, 15.55, 16.12, 16.01, 16.25, 16.09, 16.12, 16.07
Average: 16.02
Range: 0.71
5. **Day 5:**
Samples: 15.72, 15.42, 15.91, 15.74, 15.46, 15.55, 15.72, 15.63
Average: 15.63
Range: 0.49
6. **Day 6:**
Samples: 16.03, 16.03, 15.65, 15.88, 15.82, 16.
Expert Solution
This question has been solved!
Explore an expertly crafted, step-by-step solution for a thorough understanding of key concepts.

This is a popular solution

Trending nowThis is a popular solution!

Step by stepSolved in 2 steps

Knowledge Booster

Similar questions
- You want to obtain a sample to estimate a population proportion. Based on previous evidence, you believe the population proportion is approximately 72%. You would like to be 99% confident that your estimate is within 4.5% of the true population proportion. How large of a sample size is required?n =arrow_forwardYou want to obtain a sample to estimate a population proportion. Based on previous evidence, you believe the population proportion is approximately 32%. You would like to be 95% confident that your estimate is within 2% of the true population proportion. How large of a sample size is required? n = Question Help: D Post to forum Submit Question 吴☆母 NOV 2 12 W 3D ロarrow_forwardYou w population proportion is approximately 27%. You would like to be 90% confident that your estimate is within 45% of the true population proportion. How large of a sample size is required? ant to obtain a sam ple to estimate a population proportion. Based on previous evidence, you believe the Hint: Textbook Video 12arrow_forward
- You want to estimate the percentage of statistics students who get grades of C or better. How many students should you survey to be 95% confident that the sample percentage is off by no more than 2 percentage points.arrow_forwardYou want to obtain a sample to estimate a population proportion. Based on previous evidence, you believe the population proportion is approximately 85%. You would like to be 95% confident that your estimate is within 3.5% of the true population proportion. How large of a sample size is required? Do not round mid- calculation. Submit Question INarrow_forwardphosphorus-32 half life is 14.268 days 1000mg of phosphorus what would the sample size after 14.268 days & 28.536arrow_forward
- Symbols for the following: sample size sample mean population proportionarrow_forward3. Do a trial with one person. Record your data in the table below. Name Ink Color Matches Word (seconds) Ink Color Doesn't Match Word (seconds) Average: Average: 4. Evaluate your method. What worked? Do you need to make any changes?arrow_forwardYou want to obtain a sample to estimate a population proportion. Based on previous evidence, you believe the population proportion is approximately 82%. You would like to be 99% confident that your estimate is within 5% of the true population proportion. How large of a sample size is required? Hint: Video [:] = ת Submit Question Rasmuss habits-9ed-Pal 7- 7,324 NOV 1 PAGES 19 tv MacBook Airarrow_forward
- You want to obtain a sample to estimate a population proportion. Based on previous evidence, you believe the population proportion is approximately 81%. You would like to be 99% confident that your estimate is within 5% of the true population proportion. How large of a sample size is required? Do not round mid- calculation. n =arrow_forwardCalculate the proportion of the 100 samples that had at least five people own a dog. Round your answer to four decimal places. population is unknown p= .5967 n= 100arrow_forwardYou want to obtain a sample to estimate the proportion of a population that possess a particular genetic marker. Based on previous evidence, you believe approximately 69% of the population have the genetic marker. You would like to be 95% confident that your estimate is within 5% of the true population proportion. Do not round mid-calculation and be careful when you round your answer. How large of a sample size is required? n=arrow_forward
arrow_back_ios
SEE MORE QUESTIONS
arrow_forward_ios
Recommended textbooks for you
- MATLAB: An Introduction with ApplicationsStatisticsISBN:9781119256830Author:Amos GilatPublisher:John Wiley & Sons Inc
 Probability and Statistics for Engineering and th...StatisticsISBN:9781305251809Author:Jay L. DevorePublisher:Cengage Learning
 Statistics for The Behavioral Sciences (MindTap C...StatisticsISBN:9781305504912Author:Frederick J Gravetter, Larry B. WallnauPublisher:Cengage Learning
  Elementary Statistics: Picturing the World (7th E...StatisticsISBN:9780134683416Author:Ron Larson, Betsy FarberPublisher:PEARSON
 The Basic Practice of StatisticsStatisticsISBN:9781319042578Author:David S. Moore, William I. Notz, Michael A. FlignerPublisher:W. H. Freeman
 Introduction to the Practice of StatisticsStatisticsISBN:9781319013387Author:David S. Moore, George P. McCabe, Bruce A. CraigPublisher:W. H. Freeman
MATLAB: An Introduction with Applications
Statistics
ISBN:9781119256830
Author:Amos Gilat
Publisher:John Wiley & Sons Inc
Probability and Statistics for Engineering and th...
Statistics
ISBN:9781305251809
Author:Jay L. Devore
Publisher:Cengage Learning
Statistics for The Behavioral Sciences (MindTap C...
Statistics
ISBN:9781305504912
Author:Frederick J Gravetter, Larry B. Wallnau
Publisher:Cengage Learning
Elementary Statistics: Picturing the World (7th E...
Statistics
ISBN:9780134683416
Author:Ron Larson, Betsy Farber
Publisher:PEARSON
The Basic Practice of Statistics
Statistics
ISBN:9781319042578
Author:David S. Moore, William I. Notz, Michael A. Fligner
Publisher:W. H. Freeman
Introduction to the Practice of Statistics
Statistics
ISBN:9781319013387
Author:David S. Moore, George P. McCabe, Bruce A. Craig
Publisher:W. H. Freeman